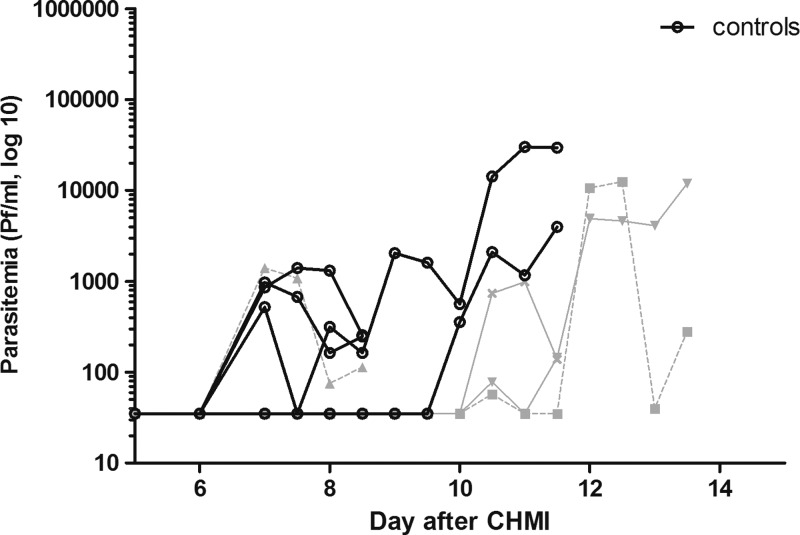
Figure 4.
Parasite dynamics by quantitative real-time polymerase chain reaction (qPCR) after controlled human malaria infection (CHMI) #2. Parasite densities are shown until the day of treatment, based on diagnosis by quantitative polymerase chain reaction. Each line represents a single subject: the gray lines represent subjects of vaccine group 3 (N = 4), the black lines subjects of control group 4 (N = 4).

