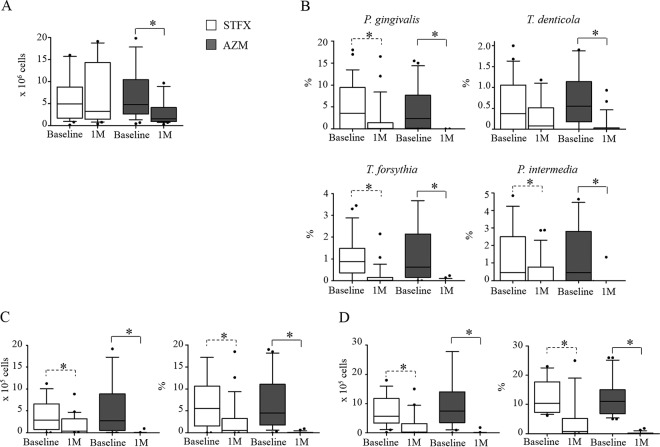
FIG 2.
Median changes in total bacterial counts (A) and proportions of each periodontopathic bacterium (B) and numbers and percentages of red complex bacteria (RCB) in all sampling sites (C) and those of sampling sites with >5% RCB proportions at baseline (D) through the 1-month (1M) experimental period. The bars indicate the upper and lower interquartile ranges. The error bars indicate the 90th and 10th percentile ranges. The dots indicate the maximum and minimum values. The significance of differences within groups was determined by the Wilcoxon signed-rank test: *, P < 0.05.

