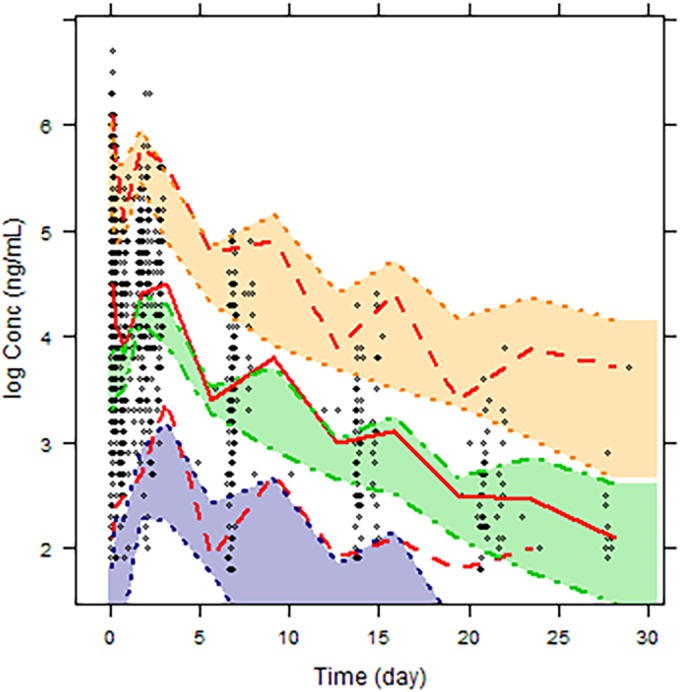
FIG 2.

Visual predictive check of the final model. The diamonds represent the observed concentrations, the dashed red lines represent the 5th and 95th percentiles, and the solid red line represents the 50th percentile obtained from the simulations. The shaded areas and corresponding dashed lines represent the simulated data prediction intervals about the observed data percentiles.
