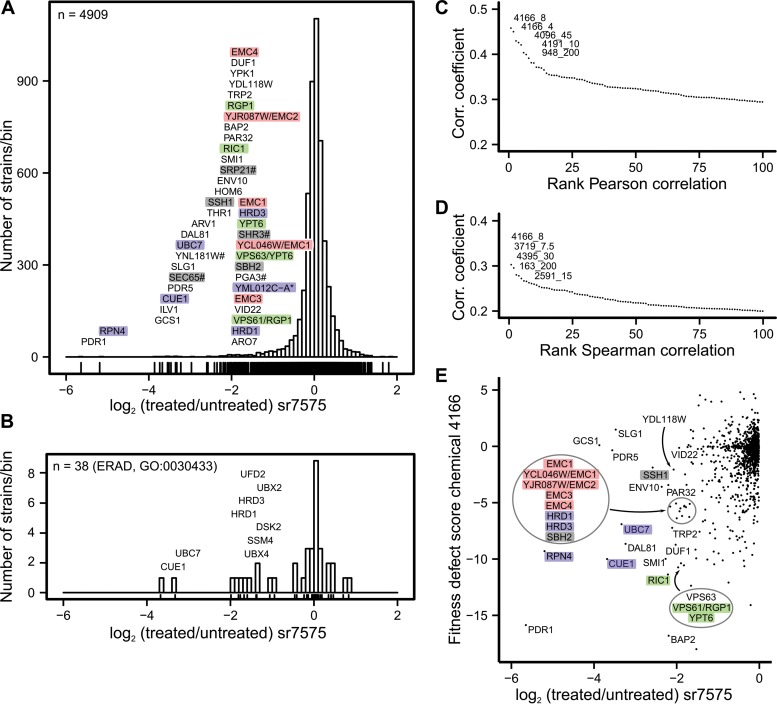
FIG 2.
Chemogenomic profiling reveals an ERAD-enriched signature for sr7575 toxicity. (A) Distribution of relative growth values for S. cerevisiae mutant strains grown in the presence of sr7575. Colors indicate functional categories from the pooled library with genes annotated as ERAD (violet), protein translocation (gray), ER membrane complex (EMC; pink), and vesicular traffic (green) showing the most sensitivity to sr7575 when mutated. Note that YML012C-A* overlaps UBX2; #, DAmP strain. (B) Distribution of sensitivity values for deletion strains affected for genes annotated with the GO term 0030433, ERAD. (C) Pearson correlation coefficients between results obtained with sr7575 and a published large-scale chemogenomics data set identifies chemical 4166 as having a profile that is most similar to sr7575. Only the scores for the top 100 correlated treatments are displayed. (D) Same as panel C, but with the Spearman rank correlation. (E) Comparison of the fitness defect scores between sr7575 and chemical 4166; gene names are color coded as described for panel A.

