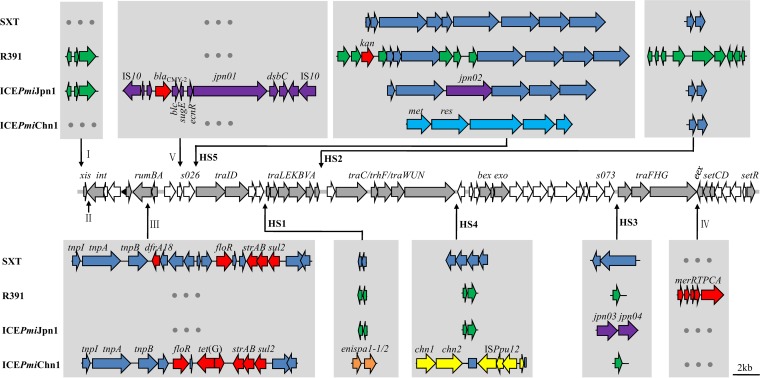
FIG 2.
Schematic view of the two SXT/R391 ICEs, ICEPmiJpn1 and ICEPmiChn1, and comparison with SXT and R391. The line of arrows in the middle represents the 52 conserved core genes of the SXT/R391 family of ICEs. HS1 to HS5 represent hot spots 1 to 5, and I to V represent the variable regions I to V. Variable genes from originally described ICEs are shown with different colors: SXT (21), blue; R391 (22), green; ICEPmiJpn1, purple; ICEPmiChn1, yellow; ICEValSpaI (10), light blue; ICEEniSpaI (9), orange. Resistance genes are in red.

