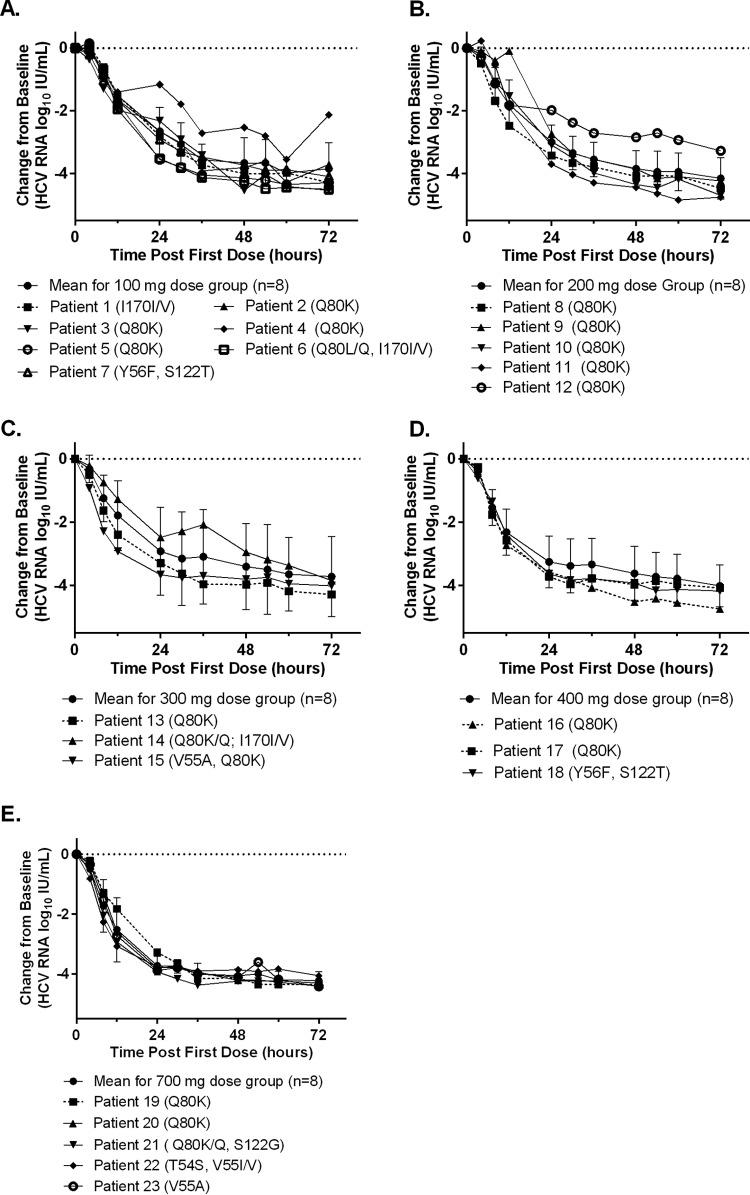
FIG 3.
Changes in HCV RNA levels from baseline in patients with baseline NS3 RAVs who received ABT-493. Data are presented as the changes in HCV RNA levels from baseline 0 to 72 h after the first dose for each patient with baseline NS3 RAVs, compared to the mean decline curves for all patients in the corresponding ABT-493 dose groups. (A) 100 mg. (B) 200 mg. (C) 300 mg. (D) 400 mg. (E) 700 mg. Standard deviations within each dose group are shown as error bars. RAVs are listed in parentheses, and a mixture of amino acids detected at a position is denoted by a slash. One patient who had a baseline NS3 Q80K variant was not included in the HCV RNA analysis due to noncompliance.

