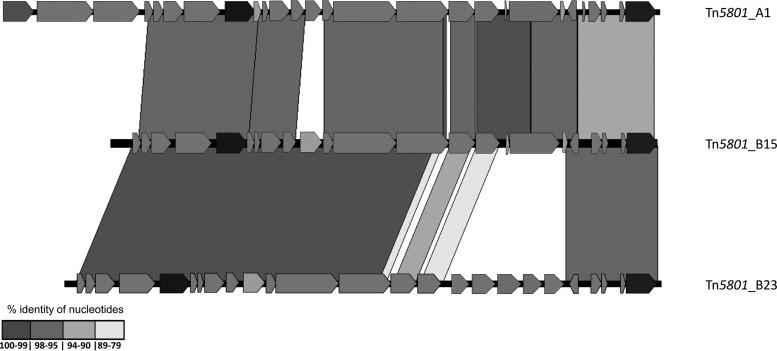
FIG 3.
Alignment of selected transposons (Tn5801_A1, Tn5801_B15, and Tn5801_B23) by using the Artemis comparison tool (ACT). Only regions of >50 bp are represented. Gray areas mark matching regions of the same orientation among ICE from different species, indicating an identity between 79 and 100%. Only the areas with the highest percentages of similarity are shown.

