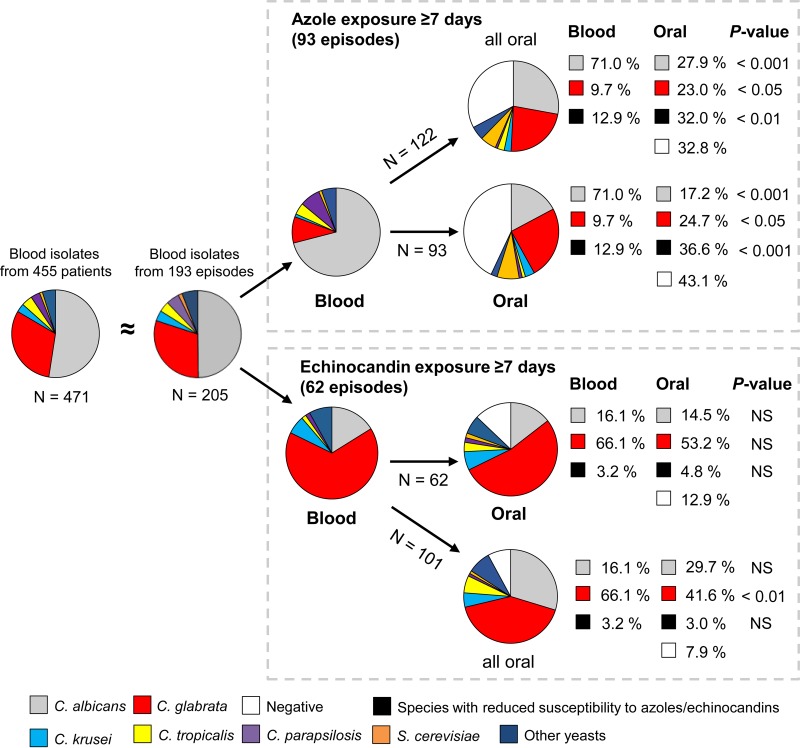
FIG 2.
Pie charts displaying species distributions in the indicated groups. N, number of isolates. Blood isolates represented baseline colonization in patients subsequently exposed to either azoles or echinocandins. Oral isolates (≥7 days of exposure) represented end-of-treatment colonization. NS, not significant. On the patient level (pie charts on the same horizontal level), only the species with the highest ECOFF value was counted in case of polyfungal samples; however, the distribution of all oral isolates is also shown (above for azoles and below for echinocandins). Proportion analysis was performed by chi-square and Fisher's exact tests.

