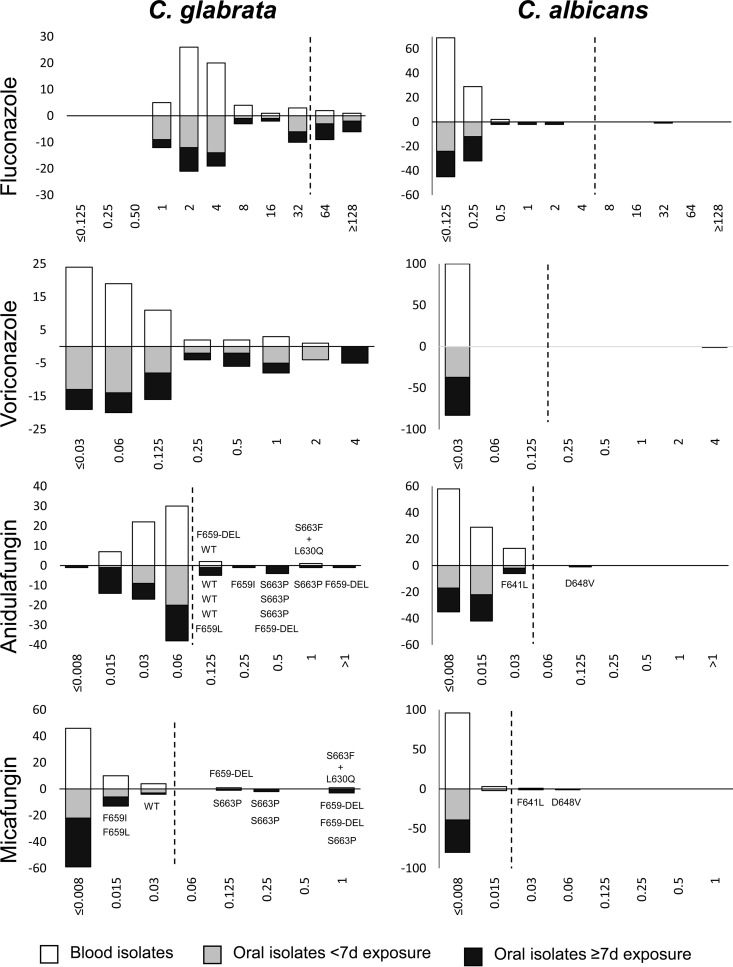
FIG 3.
MIC distributions for C. glabrata (left) and C. albicans (right). MICs are given in milligrams per liter. White bars show data for blood isolates, gray bars are for swab isolates obtained after <7 days of exposure to either azoles or echinocandins, and black bars are for swab isolates obtained after ≥7 days of exposure to either drug class. The rows display MIC distributions for (top to bottom) fluconazole, voriconazole, anidulafungin, and micafungin. The y axis indicates the number of isolates either from blood (positive) or from swabs (negative).

