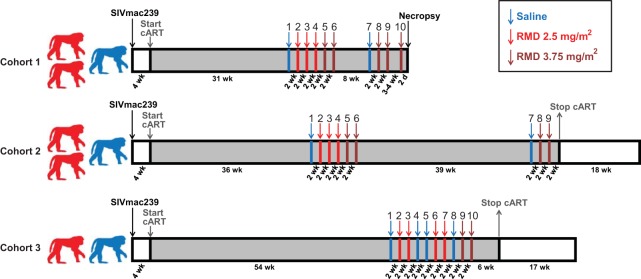
FIG 1.
Study schema with the duration of each study phase indicated for each of the three study cohorts. Red macaque silhouettes represent RMD-treated animals; blue silhouettes represent saline control-treated animals. Gray regions of the diagram represent study phases in which animals were treated with combination antiretroviral therapy (cART). Infusions are represented by enumerated arrows. Blue arrows represent infusions of saline into all cohort animals. Red and dark red arrows represent infusions of RMD at 2.5 mg/m2 and 3.75 mg/m2, respectively, into RMD-treated animals and saline infusions into saline control-treated animals.

