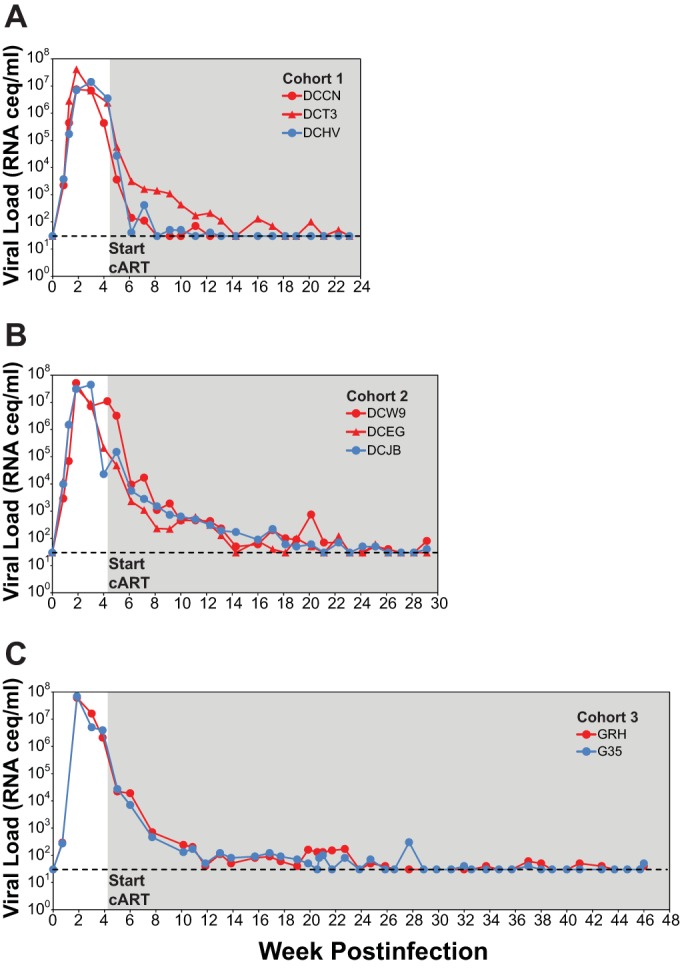
FIG 2.

Plasma viral loads in cART-suppressed macaques prior to RMD administration. Longitudinal plasma viral loads for RMD treatment (red symbols) and saline treatment (blue symbols) animals for cohort 1 (A), cohort 2 (B), and cohort 3 (C) animals are shown. All three study cohorts initiated cART at 4 weeks postinfection (gray-shaded region). The dashed lines represent the assay quantification limit of 30 vRNA copies/ml of plasma.
