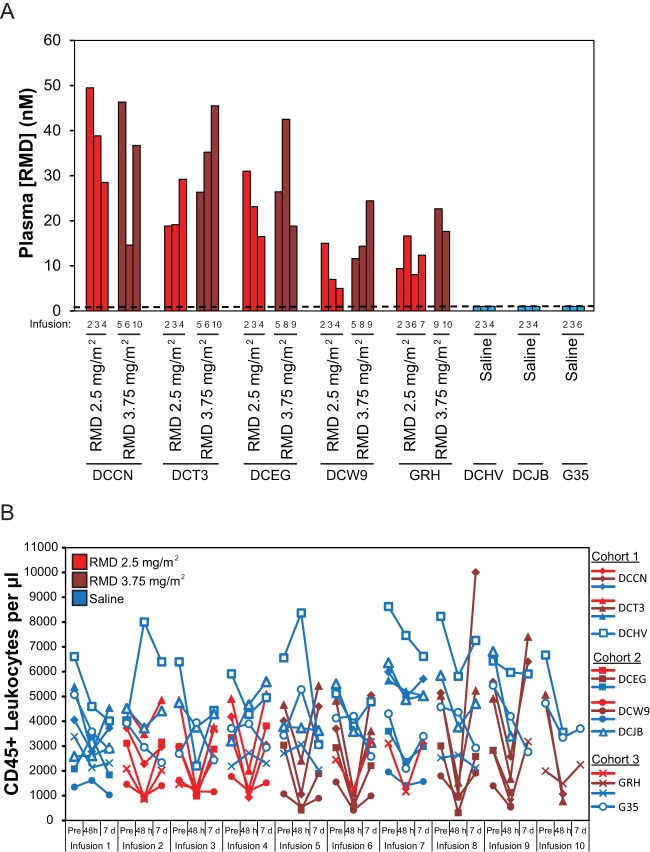
FIG 4.
Plasma RMD concentrations (A) and changes in leukocyte counts (B) following in vivo RMD administration. (A) Plasma RMD concentrations were measured at 4 h postinfusion initiation for the indicated infusions of RMD at 2.5 mg/m2 (red bars), 3.75 mg/m2 (dark red bars), or saline (blue bars). The dashed line represents the assay quantification limit of 1 nm. (B) CD45+ leukocyte counts in whole blood for all study animals immediately prior to and at 4 h and 7 days postinfusion initiation for all study infusions. Blue plot symbols represent saline control infusions for both saline-treated animals and RMD-treated animals, while red and dark red plot symbols represent RMD infusions at 2.5 mg/m2 and 3.75 mg/m2, respectively.

