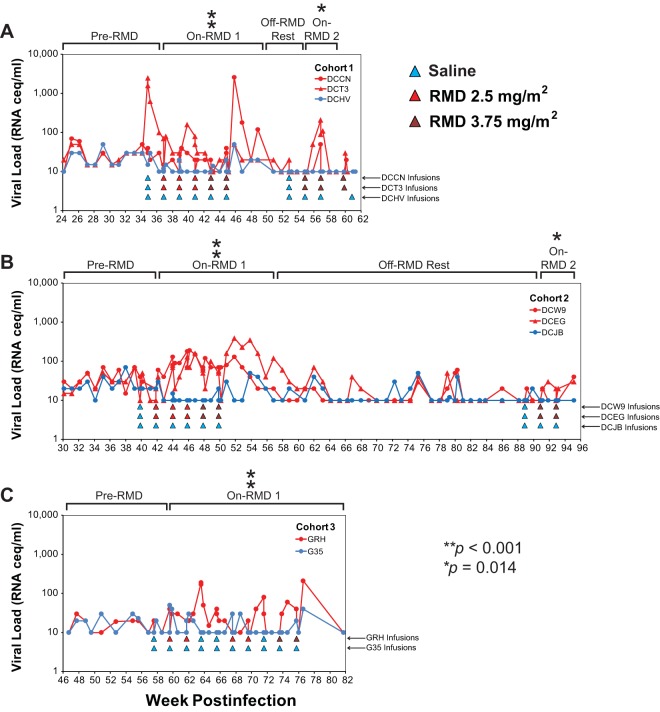
FIG 6.
Plasma viral loads in cART-suppressed macaques during RMD treatment phase of the study. Longitudinal plasma viral loads for RMD-treated (red symbols and traces) and saline-treated (blue symbols and traces) animals in cohort 1 (A), cohort 2 (B), and cohort 3 (C) are shown. Viral loads below the limit of quantification are plotted as the assay quantification limit for that time point (10 to 30 vRNA copies/ml, dependent upon available plasma volumes). The infusions for each animal are indicated by colored triangles beneath the plots. The asterisks denote study phases in which biweekly maximum pVL measurements were significantly higher in RMD-treated versus saline control-treated animals (see Materials and Methods).

