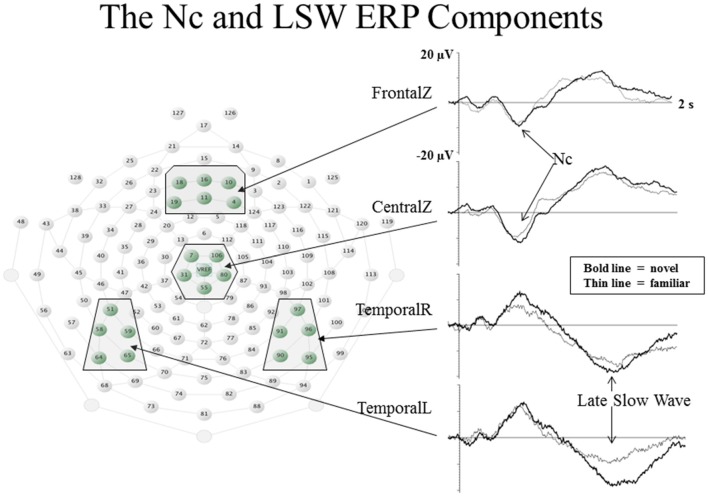
Figure 2.
Event-related potential (ERP) waveforms and electrode locations for the Nc and late slow wave (LSW) ERP components. The ERP waveforms are shown to the right. Change in amplitude of the ERP from baseline values is represented on the Y-axis, and time following stimulus onset is represented on the X-axis. The electrode locations for each of the waveforms are shown to the left in boxes on the layout of the EGI 128-channel sensor net (figure adapted from Reynolds et al., 2011).

