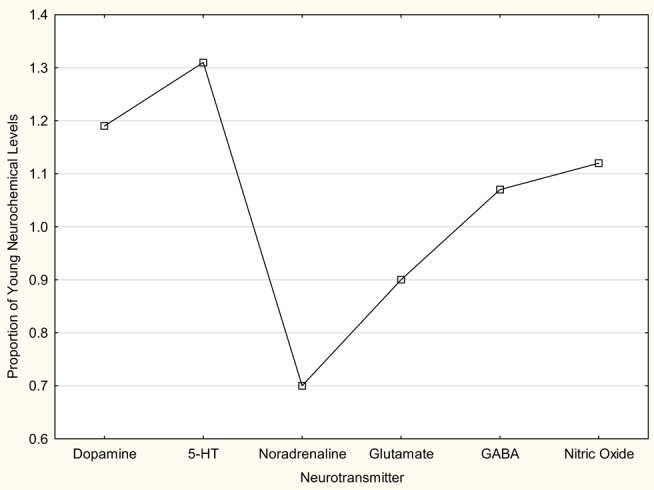
Figure 5.

Schematic diagram of changes in levels of dopamine, 5-HT, noradrenaline, glutamate, GABA and nitric oxide, with age. The data regarding dopamine and 5-HT are from Table 1 in Cransac et al. (67). The data regarding noradrenaline are estimated from Figure 1 in the same paper. The data regarding glutamate and GABA are from Liu et al. (69). The nitric oxide levels are estimated from the levels of the coproduct l-citrulline (i.e., both are produced from the action of nitric oxide synthase on l-arginine), also from Liu et al. (69). In all cases, the young data are from rats at 3–4 months of age and the aged data from animals at 24 months of age. The data from Cransac et al. (67) are from the MVN whereas the data from Liu et al. (69) are from the VNC as a whole. In all cases, the aged data are expressed as a proportion of the mean values for the young data in each study, in order to make comparisons across studies possible. The changes in 5-HT, noradrenaline, glutamate, and nitric oxide were statistically significant.
