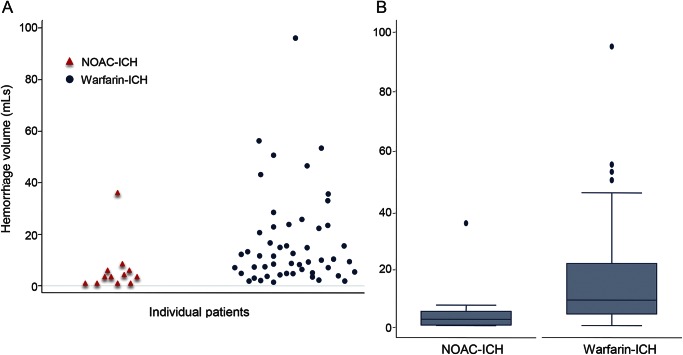
Figure 2. Dot plot and box plot.
(A) Dot plot of individual participants and their corresponding hemorrhage sizes. Blue dots show warfarin–intracerebral hemorrhage (ICH); red triangles show non–vitamin K oral anticoagulant (NOAC)–ICH. (B) Box plot shows median, lower and upper quartiles, and minimum and maximum values of hematoma volume for NOAC-ICH cases and warfarin-ICH cases.

