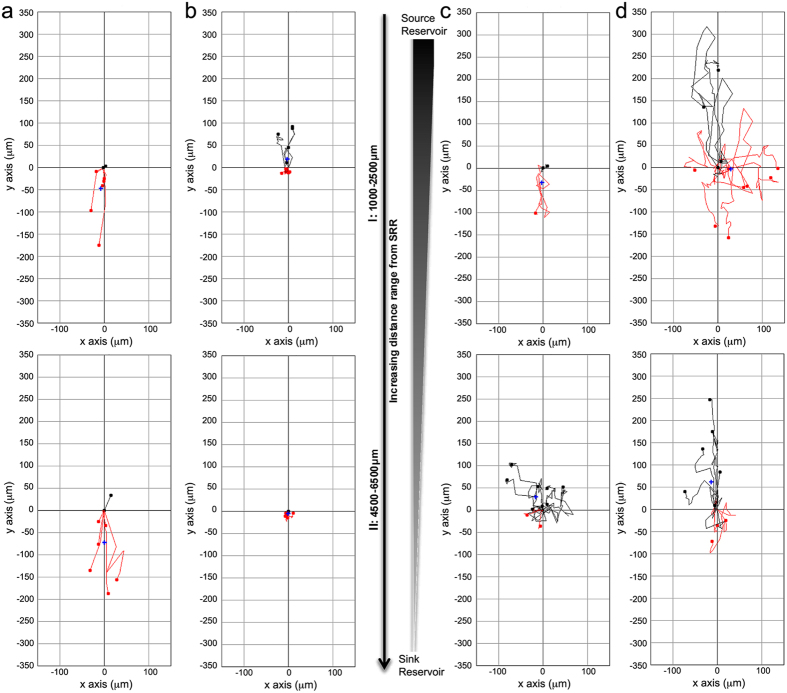
Figure 7. Wind-Rose plots of PPC and RPC migratory dynamics in microfluidic gradients of SDF-1α.
PPC and RPC SDF-1α gradient induced migratory dynamics were imaged over a 24 hr period, in13 mm microfluidic μ-lane devices. PPC and RPC movements were tracked and are depicted in wind-rose plots at increasing distances from the source reservoir (SRR): 1000–2500 μm (I), 4500–6500 μm (II). (a) PPC migration in control conditions shows random and increased non-directed migration. (b) In 100 ng/ml SDF-1α steady-state gradients PPC exhibit significant directed migration toward the SDF-1α source. (c) RPC dynamics in the absence of the SDF gradient (control) resulted in increased random Euclidean movement away from the ligand source. (d) In the presence of the100 ng/ml SDF-1α gradient, both RPCs and PPCs show significant difference in their center of mass (COM) toward the Y-axis source of SDF-1α (Fig. 6: PPCs p = 0.0033, RPCs p = 0.0135). Red and black traces indicate cells with negative (away) and positive (toward) COM, relative to the ligand source. The X- and Y-axis denote cell displacement in horizontal and vertical directions, respectively. All measurements of migration dynamics were performed between 18–42 hrs, in the presence of steady state nanomole SDF-1α gradients. Complete descriptive statistics of the trajectory plots depicted here are reported in Table 2.

