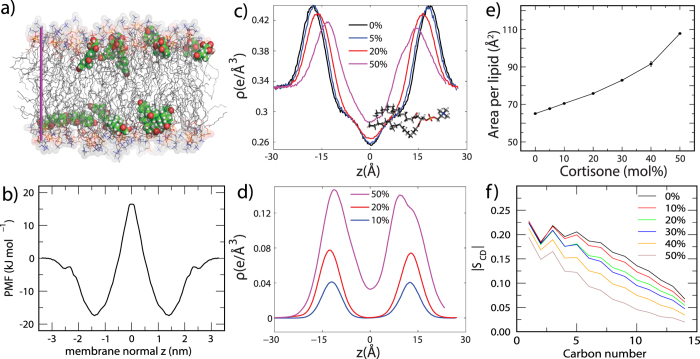
Figure 1.
(a) A simulation snapshot of a POPC membrane containing 10 mol% cortisone; POPC is show as sticks, cortisone as solid spheres. Water is not shown for clarity. (b) Potential of mean force (PMF) for cortisone across along the membrane normal z. z = 0 corresponds to the membrane center. (c) Electron density profiles calculated from simulations. (d) electron density of cortisone. (e) Area per phospholipid molecule as a function of cortisone content. (f) Deuterium order parameter of the saturated POPC tail as calculated from the simulations.

