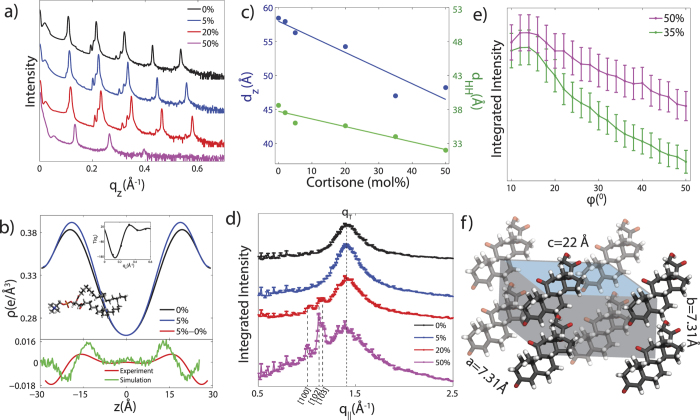
Figure 3.
(a) Out-of plane X-ray diffraction of oriented POPC membranes containing cortisone. (b) Top: scaled electron densities across the axis perpendicular to the bilayer for 0 mol% and 5 mol% cortisone. Bottom: the difference of these curves shows a positive peak at  Å, indicating the position of cortisone, and a negative peak at
  Å due to the thinning of the membrane. The difference curve from the MD simulations at 5 mol% is included for comparison. The slight disagreement in peak position and width between experiment in simulation is likely due to bilayer undulations28. An example of
  is shown as an inset. (c) The lamellar spacing,
  , and the head-head distance,
  , as a function of cortisone concentration as determined from diffraction experiments. (d) Scattering along
  for the oriented membrane samples. Additional peaks, which appear for cortisone concentrations >20 mol%, can be indexed by crystalline cortisone. (e) The integrated intensities for the crystalline cortisone peak observed at
  Å−1 as a function of azimuthal angle ϕ. (f) Unit cell of the observed cortisone crystallites, as determined from the in-plane Bragg peaks.

