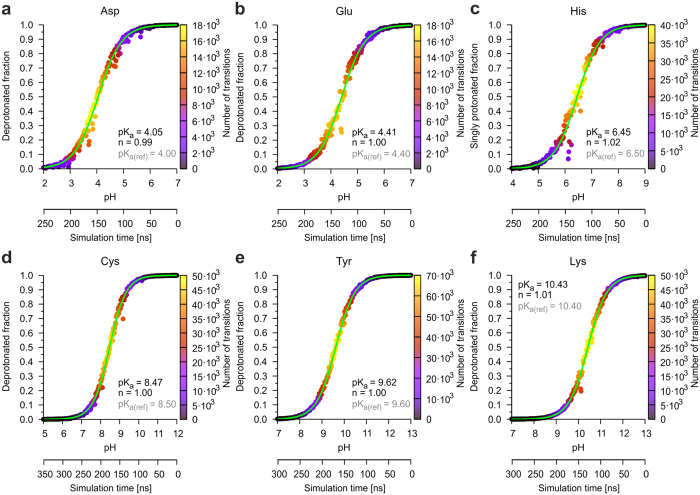
Figure 2. Titration curves for side chains in the Ace-X-Nme model compounds.
(a–f) Observed titration curves for the amino acid side chains in the Ace-X-Nme model compounds (X = Asp, Glu, His, Cys, Tyr or Lys) from MD simulations in which the pH was gradually lowered over time. The measured deprotonated fraction or the singly protonated fraction in the case of histidine is color-coded according to the number of transitions. As expected, the highest number of transitions can be observed near the pKa value. Additionally, the simulation time is shown as a second x-axis for orientation. The fitted curve, used for the calculation of the pKa value and the Hill coefficient n, is shown as a green line. Reference pKa values are given as gray text (reference values for Asp, Glu, Tyr, Lys taken from Bashford et al.39; value for His taken from McNutt et al.40; and value for Cys taken from Stryer41).

