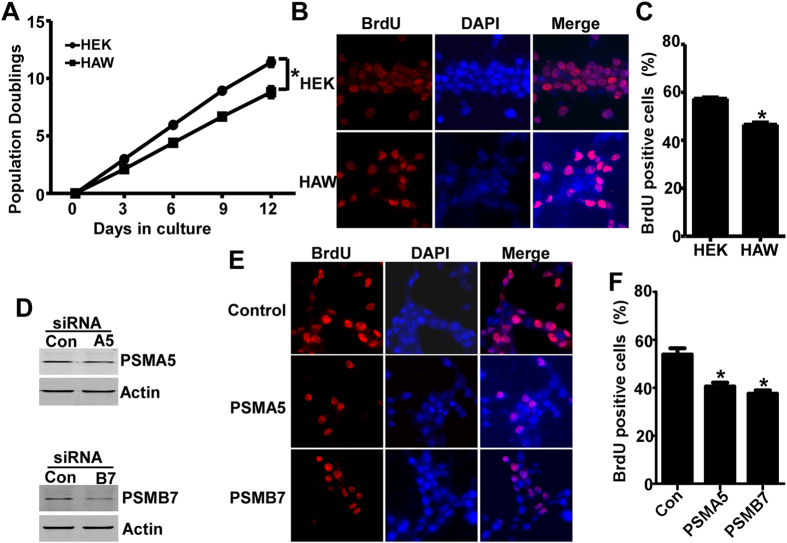
Figure 4. APP overexpression inhibits cell proliferation and the downregulation of two identified genes is involved in proliferation impairment.
(A) Growth curve of HEK293 cells and HAW cells. Equal number of cells was seeded on 35 mm dishes and the cell number was counted every 3 days. The growth curve was plotted after 12 day’s culture. Values represent mean ± SEM. N = 3, *p < 0.05 by ANOVA. (B) BrdU cell proliferation assay of HEK293 and HAW cells. After 6-hour incubation with BrdU, BrdU incorporation was detected by BrdU antibody followed by cy3-conjugated anti-goat IgG (Red). Nuclei were stained with DAPI (Blue). (C) Quantification of BrdU positive cells in HEK293 and HAW cells. The percentage of BrdU-positive cells in each line was presented. Values represent mean ± SEM. N > = 3, *p < 0.05 by student t-test. (D) 3 days after scramble, PSMA5 or PSMB7siRNA transfection, the expression of PSMA5 or PSMB7 was examined by Wstern blot. PSMA5 or PSMB7 was detected by PSMA5 or PSMB7 antibody. β-actin served as internal control was detected by mouse anti-actin antibody. (E) 3 days after scramble, PSMA5 or PSMB7siRNA transfection, BrdU cell proliferation assay was performed. BrdU incorporation was detected by BrdU antibody followed by cy3-conjugated anti-goat IgG (Red). Nuclei were stained with DAPI (Blue). (F) Quantification of BrdU positive cells. The percentage of BrdU-positive cells in each line was presented. Values represent mean ± SEM. N > = 3, *p < 0.05 by student t-test.

