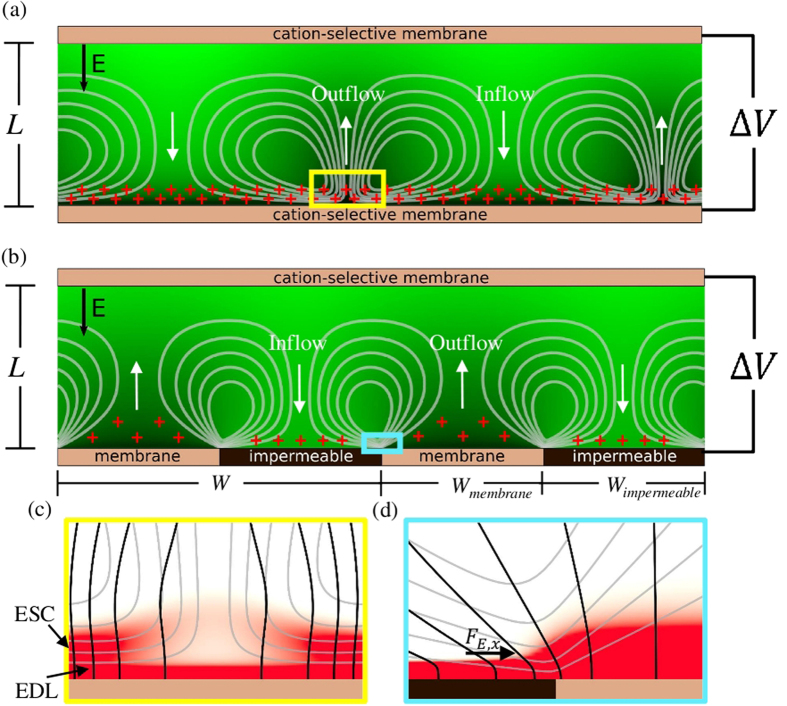
Figure 2. Schematic showing the two model problems investigated.
(a) Upper and lower surfaces are both cation-selective membranes. (b) The lower surfaces is patterned with membrane (ion-permeable) and impermeable regions. In both (a,b), the color field represents species concentration with brighter (green) colors indicating higher concentrations. Cation and anion concentration fields are visually identical when plotted at this scale due to local electroneutrality. (c,d) Show charge-density fields zoomed in on the boxes (yellow and blue respectively) in (a,b). Light gray lines are flow streamlines, and black lines are electric field lines.

