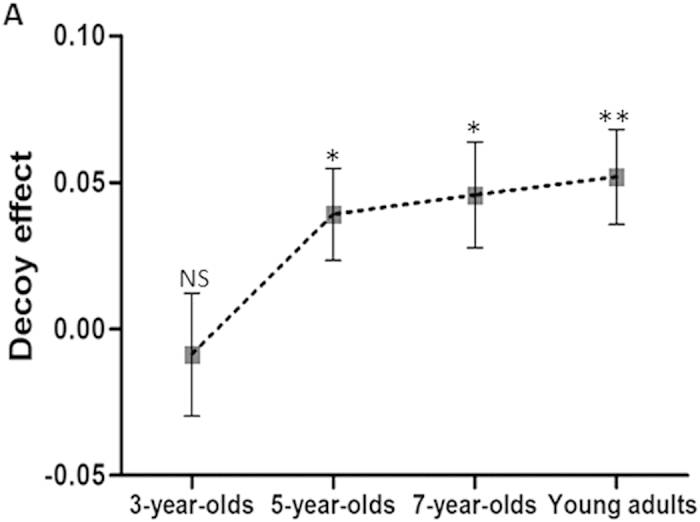
Figure 2. Behavioral results.

(A) Mean decoy effect (the proportion of choosing the target option minus the proportion of choosing the competitor option) as a function of age group (3-year-olds, 5-year-olds, 7-year-olds and young adults). Error bars represent standard errors. NS, not significant. *p < 0.05. **p < 0.01.
