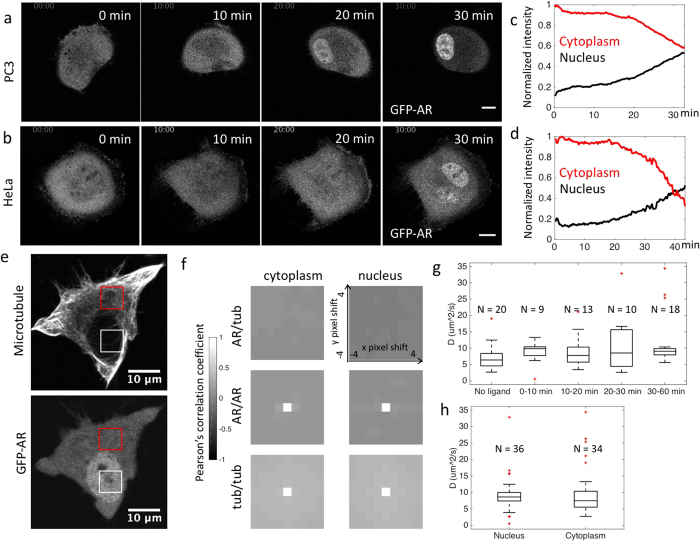
Figure 1. Diffusion contributes to GFP-AR distribution in a cell.
(a) Time lapse images of a PC3 cell expressing GFP-AR treated with Cl-4AS-1 at 0 minutes. GFP-AR shows clear translocation from the cytoplasm to the nucleus around 20 minutes. Notice the distribution of GFP-AR in the cytoplasm is relatively uniform even with the presence of agonists. (b) Time lapse images of a HeLa cell expressing GFP-AR treated with Cl-4AS-1 at 0 minutes. GFP-AR translocation dynamics is similar to (a). Scale bar: 10 μm. (c,d) GFP-AR cytoplasm (red line) and nucleus (black line) normalized total intensity change over time from time lapse of (a,b). Images were acquired at 15 s/frame and 20 s/frame, respectively. (e) A PC3 cell expressing GFP-AR stained with SiR-tubulin that highlights microtubules, stimulated with Cl-4AS-1 for 24 minutes. While SiR-tubulin shows fibrous structure, GFP-AR is uniformly distributed in the cytoplasm. (f) Unlike the auto-correlations which represent 100% co-localization at 0 pixel shift (Pearson’s correlation coefficient (rp = 1), the cross-correlation of GFP-AR and SiR-tubulin showed no strong correlation for all pixel shifts between -4 and 4, indicating no clear co-localiztion of SiR-tubulin and GFP-AR. (g) GFP-AR diffusion coefficient measured before and after ligand (Cl-4AS-1) treatment. No significant difference was detected among these groups, suggesting the mobility of the diffusive GFP-AR was not significantly affected by the addition of AR agonists (1 way ANOVA, p value = 0.58). (h) GFP-AR diffusion coefficient measured by RICS at nucleus (D = 9.25 ± 5.27 μm2/s) and cytoplasm (D = 9.72 ± 7.3 μm2/s). No significant difference was found between GFP-AR diffusion rates in cytoplasm and nucleus (two-sided t test, p value = 0.76).

