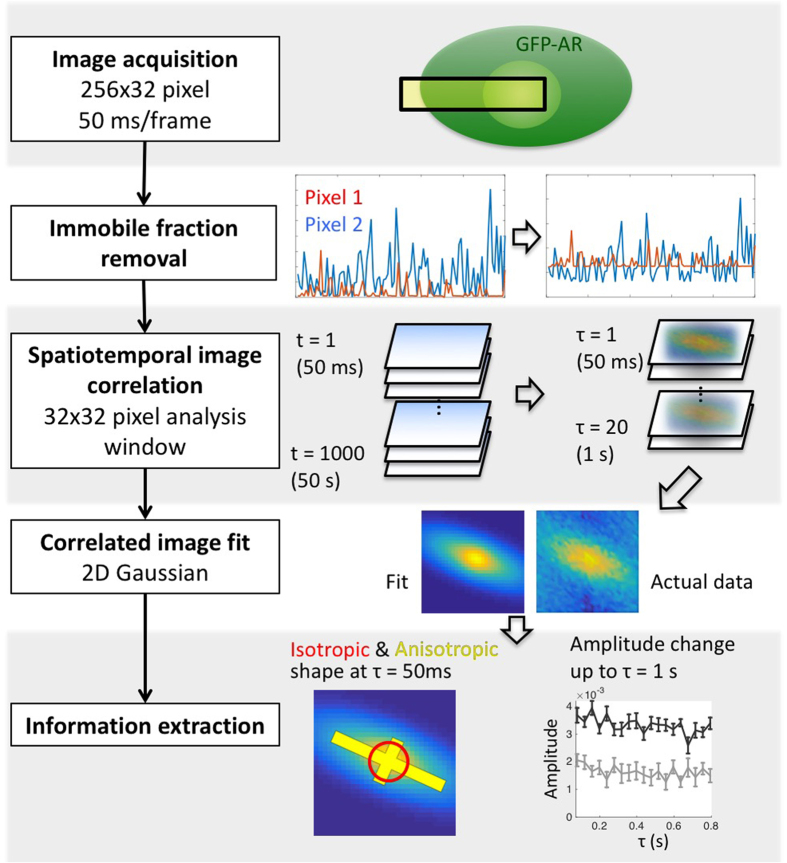
Figure 2. Workflow of mICS analysis for kinetic measurement.
To analyze the GFP-AR anisotropic motion as well as its slower kinetics, we implemented mICS analysis. Image acquisition: First, images were acquired at 256 × 32 pixel format to capture both the cytoplasm and the nucleus portions, while maintaining the acquisition speed close to 50 ms/frame by a conventional confocal microscope. 1000 frames were acquired for each measurement. Immobile fraction removal: The acquired time stack was corrected for photo-bleaching and removing immobile fractions so that the correlation is only consists of pixel intensity fluctuation. Spatial temporal image correlation: mICS was applied in 32 × 32 pixel windows, transforming the time series (t = 1 to 1000) into a time delay series (τ = 1 to 20, corresponds to time delay = 50 ms to 1 s) of pixel-shift correlation. Correlated image fit: The time delay series was then fitted with two 2D Gaussians to extract the isotropic diffusion/binding as well as the directional confined particle movement. Information extraction: The fitting result was presented both schematically to illustrate its size and anisotropic directionality, and in detail to show the change over τ. For detailed descriptions see Method: mICS analysis.

