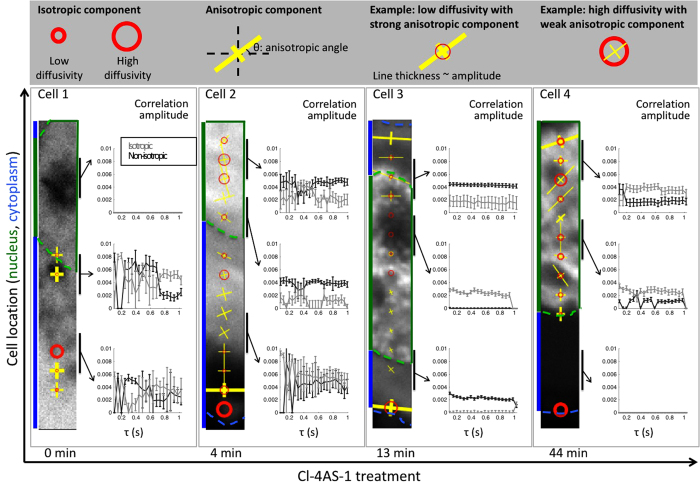
Figure 3. GFP-AR kinetics across cell shown by mICS analysis.
We applied mICS analysis to images of GFP-AR expressing PC3 cells under Cl-4AS-1 treatment. A 32 × 32 pixel analysis window at a step size of 16 pixels (half analysis window overlap) was applied along the 256 × 32 pixels image stack. At each analysis window, we overlaid with the kinetic features at τ = 1 to the original images by the following symbol: The isotropic diffusion/binding is represented as red circle, where the diameter corresponds to the FWHM from the isotropic Gaussian fit; the anisotropic confined movement is represented as cross, where the FWHM of the Gaussian long and short axis correspond to the length of the yellow lines. The circle/line thickness is based on the relative amplitudes of those components. The time delay series of selected locations were depicted to show the kinetic timescale. The error bar was calculated based on the Hessian matrix. Within the nucleus, GFP-AR showed striking transition from no detectable slow motion before Cl-4AS-1 treatment, to long, consistent binding. Within the cytoplasm, GFP-AR showed more heterogeneity. Note that the anisotropic component showed consistent amplitude over τ, indicating the confinement is stable at second time scale.

