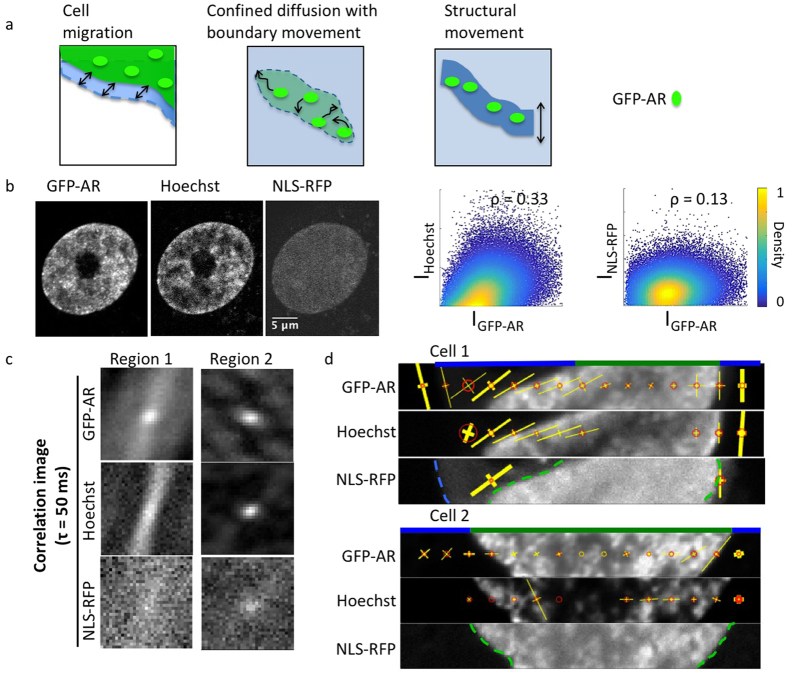
Figure 5. Comparison of the anisotropic motion from GFP-AR, Hoechst, and NLS-RFP after Cl-4AS-1 treatment.
(a) The anisotropic correlation detected by STICS could be due to cell migration, confined diffusion, or structural movement. See Supplementary Figure 2 for simulations of each scenario. (b) With the presence of agonistic ligand, GFP-AR binds to certain locations on the chromosome, which shows more similarity to Hoechst stain (Pearson’s coefficient = 0.33) than NLS-RFP (Pearson’s coefficient = 0.13) that diffuses in the nucleus. (c) Two examples of GFP-AR, Hoechst, and NLS-RFP correlation from images acquired simultaneously. With the presence of ligand, GFP-AR and Hoechst exhibit similar, yet different correlation pattern in the nucleus. NLS-RFP, on the other hand, showed very weak correlation due to its fast diffusion. (d) Two examples of mICS analysis across a cell showing higher dynamical similarities between GFP-AR and Hoechst stain.

