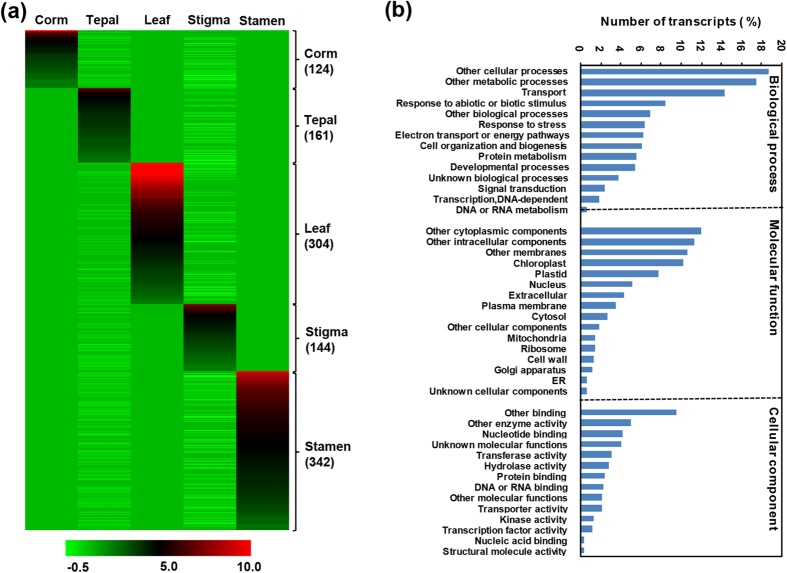
Figure 5. Tissue specific expression and functional annotation of C. sativus transcripts.
(a) Heatmap showing tissue-specific expression in all the five tissues. Number of transcripts exhibiting specific expression in different tissues has been indicated on the right side. Color scale representing normalized expression values is shown at the bottom. (b) GOSlim analysis of transcripts specifically expressed in one tissue.

