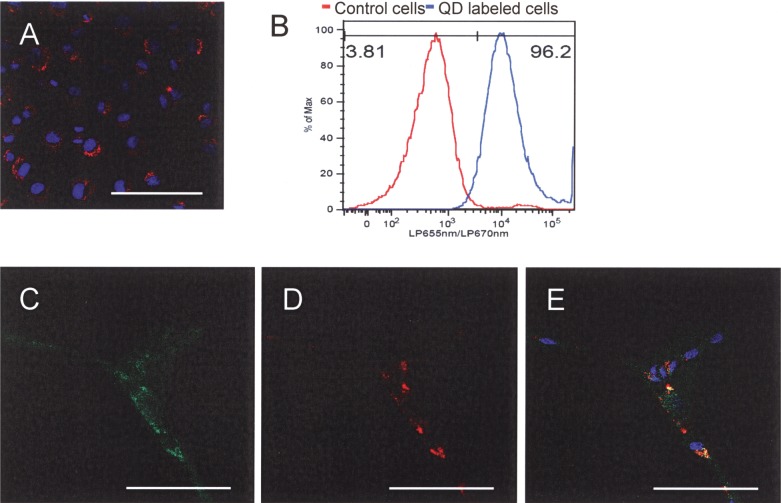
Figure 2.
Representative confocal image of EPCs after incubation with 8 nM QDs for 24 h (blue fluorescent is nuclear staining with DAPI; red is QD fluorescence signal). (B) Flow cytometry analysis of QD loading efficiency. (C–E) EPCs that formed capillary tubes are all positive for QDs and took up Dil-Ac-LDL. (C) Dil-Ac-LDL; (D) QD fluorescence; (E) merged image (green: Dil-Ac-LDL; Red: QD fluorescence; blue: nuclear staining with DAPI). Scale bars: 100 µm.

