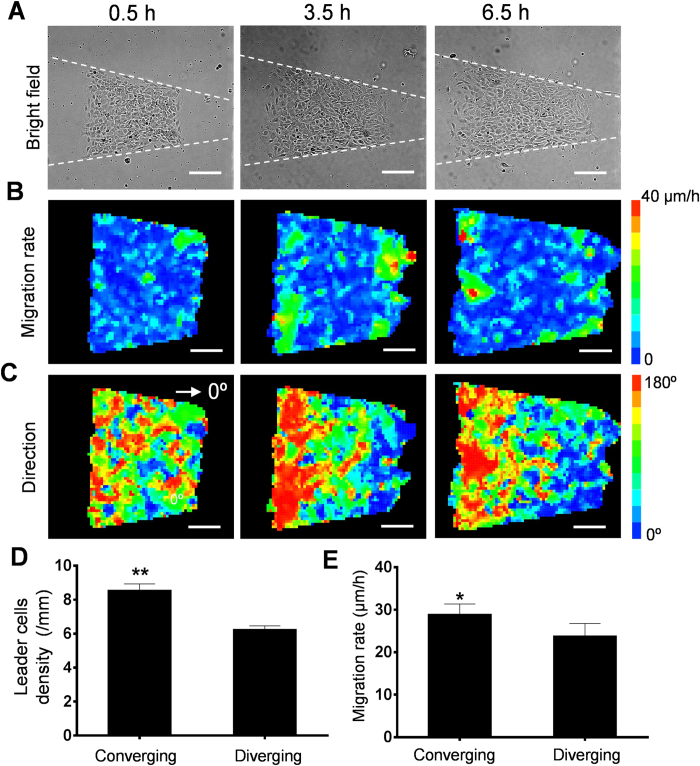
Figure 6. The size and coherence of the migrating clusters in competing cell patterns.
(A) Representative images of the competing wound healing assay at 0.5 hours, 3.5 hours, and 6.5 hours after removal of the PDMS blocker. (B,C) The migration rate and migration direction of the competing cell structure. (D,E) The density of leader cells and the migration rate at the diverging and converging ends 6.5 hours after removal of the PDMS blockers. Images are representative of five independent experiments. Data represent mean ± s.e.m. (n = 4; *p < 0.05, **p < 0.01).

