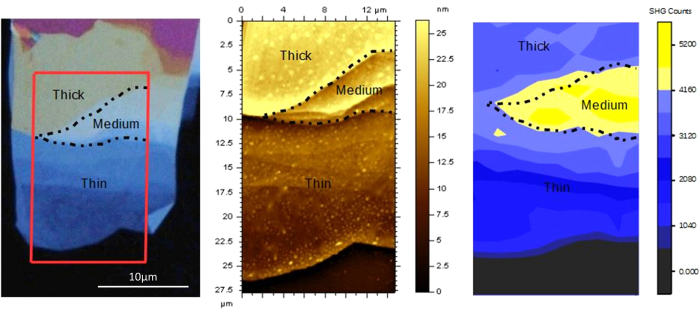
Figure 2. 2D map of SHG generated from an InSe flake with regions of different thickness.
(a) High resolution optical image of InSe flake. The red box shows the roughly 15 × 35 μm scan area for b and c. (b) Atomic Force Microscopy (AFM) image of the flake showing thicknesses ranging from 9 to 25 nm. (c) 2D map with ~1 μm spatial-resolution of the emitted SHG from different regions of the InSe flake. We see different strengths of SHG intensity from different thicknesses. In all three figures, the dashed black line marks the region of ~20 nm thickness (labeled as ‘Medium’) which emits a five-fold and two-fold greater SHG signal compared to the regions of 10 nm thickness (labeled as ‘Thin’) and regions of 25 nm thickness (labeled as ‘Thick’) respectively.

