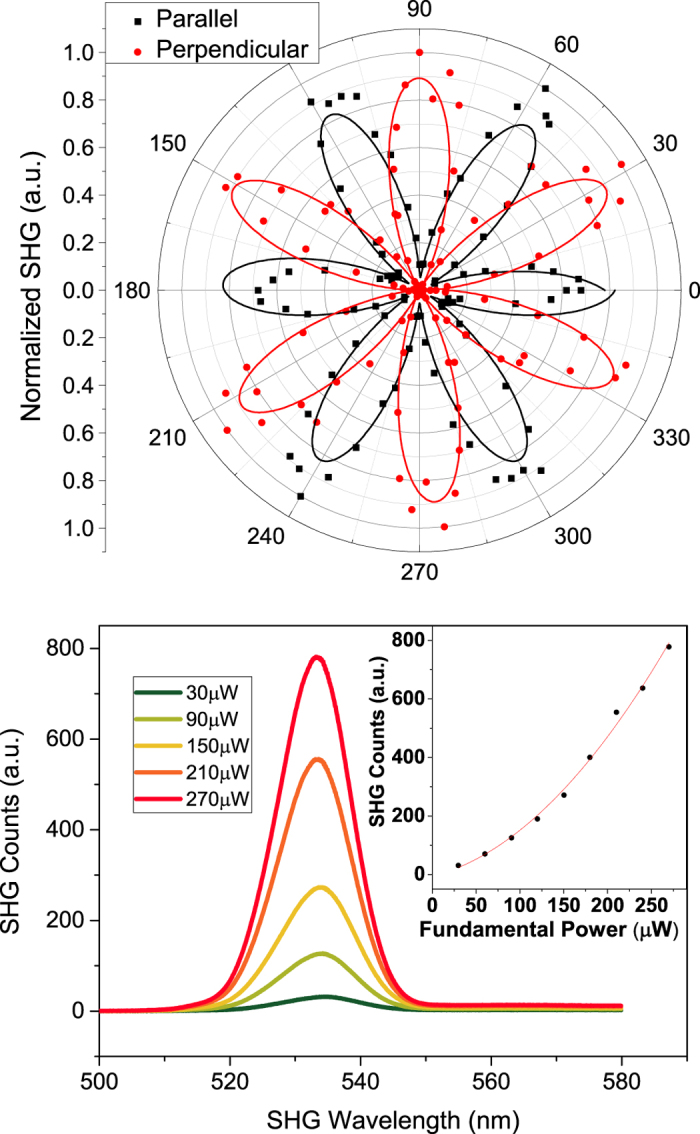
Figure 3. Polarization and Power dependence of SHG.

(a) Measured intensity of SHG components perpendicular (red dots) and parallel (black dots) to the fundamental polarization as the sample is rotated. Black and red lines are their respective fits showing a cos2(3θ) and a sin2(3θ) dependence, respectively. (b) SHG spectrum and intensity, which scales as the square of the intensity of the fundamental beam (inset).
