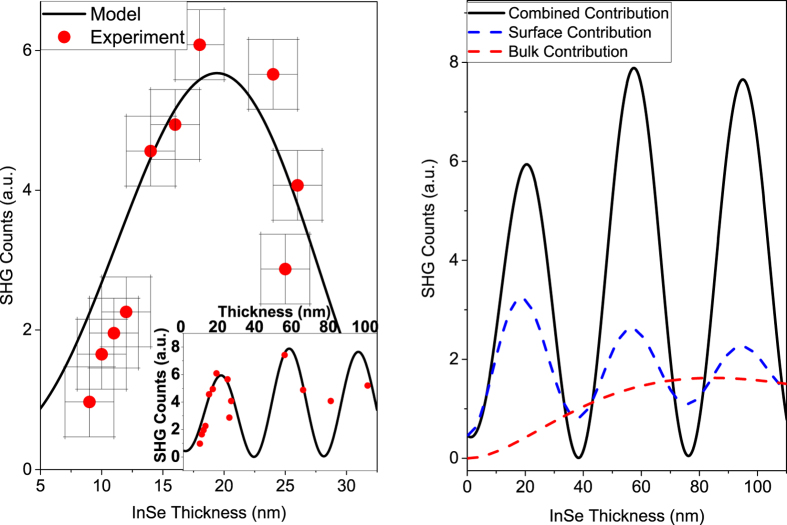
Figure 4. Model and experimental data for emitted SHG intensity versus InSe thickness.
(a) Detailed plot of measured SHG counts (red dots) versus InSe thickness in the 9–25 nm range. Error bars show estimated error for thickness and SHG measurements. The unexpected peak at ~20 nm thickness in the SHG intensity is explained as constructive interference between surface and bulk components in our model (black line). Inset: SHG counts versus thickness for slightly larger thicknesses. (b) Surface (dashed blue) and bulk (dashed red) nonlinear contributions in our model plotted separately, which give rise to the high contrast interference of the total nonlinear response (solid black line) as a function of InSe thickness. The relatively weaker oscillations seen in the surface component (dashed blue) are a result of interferences between the contributions from the InSe-Air and the InSe-substrate interfaces. Particular to van der Waals crystals, one sees a large surface contribution even for monolayers, which can then be comparable to the bulk nonlinear contribution, as the crystal thickness can be fine-tuned layer-by-layer, thus creating a novel opportunity to study their interplay and optimize their nonlinear response.

