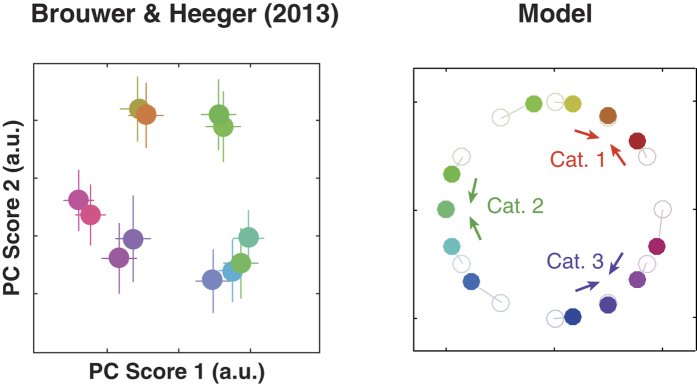
Figure 3. The model replicates clustering of population representation toward categorical centers under the categorical effects.
(Left) Human VO1 responses to color stimuli, where multi-voxel patterns of fMRI neural activation were embedded in the first and the second principle components. Data replotted from Ref. 40. (Right) The model prediction. The vertical and horizontal axes represent a two-dimensional stimulus space, where the direction from the origin corresponds to stimulus hue while the deviation from the origin corresponds to the vividness of color (i.e., the origin corresponds to the white point). The colored dots indicate the stimulus properties represented by simulated neural population activities, by “decoding” the population activity [which is done by projecting the combinations of (peak locus, peak height) to the corresponding positions of this space]. Light-colored dots indicate the input stimuli while the dark-colored dots represent the neural population representation. The colors of markers correspond to those of presented stimuli. Here, we assumed three categories whose centers were in direction of  ,
,  , and
, and  radians. The figure demonstrates that neuronal representations are biased towards the categorical centers. We used the same parameters as in Fig. 2 for consistency across the simulations; note that the strength of clustering depends on the magnitude of top-down interaction.

