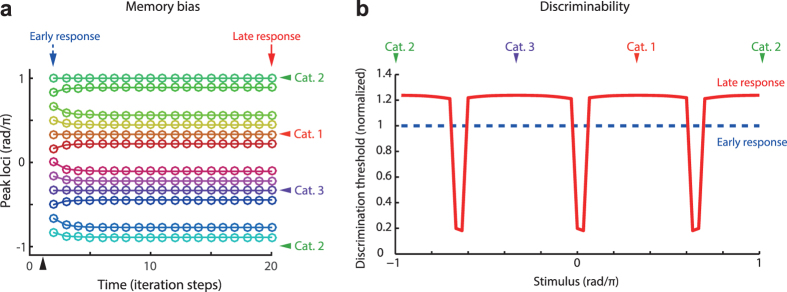
Figure 4. The model explains categorical effects on the bias and discrimination threshold in memorized color.
(a) Temporal evolution of activity peak. The colored markers indicate the loci of peaks in the modeled neural population for each time step of simulation. The traces for 12 different stimuli are superimposed, where the colors of traces correspond to those of presented stimuli. The black arrow head on the horizontal axis indicates the timing of the stimulus onset. (b) The categorical effects on the stimulus discriminability. The solid curve indicates the threshold computed with the late response (time step = 20) after the stimulus onset; the dashed line indicates the threshold computed with the early response (time step = 2). The time points correspond to the solid and dashed arrows in panel a. The discrimination thresholds were normalized by that of the early response. Here the figures show the case in which three categorical centers were located uniformly on the hue circle. In panels a and b, the colored arrow heads with “Cat. x” indicate loci of the categorical centers.

