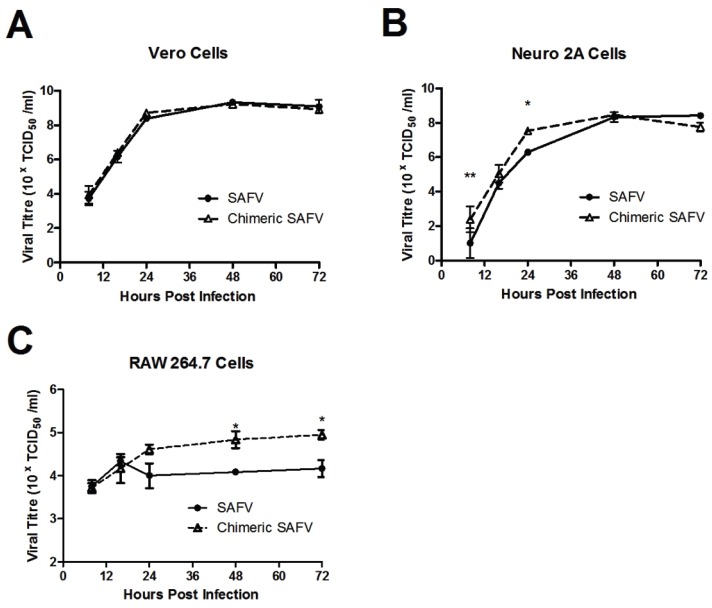
Figure 3.
Growth Kinetics of SAFV or chimeric SAFV in Vero (A); Neuro2a (B) or RAW 264.7 (C) cells. Data presented in mean ± SEM. There was an effect in time in all cells, an effect of virus in Neuro2A and RAW 264.7, but not Vero cells, and an effect of interaction only in RAW 264.7, but not Vero or Neuro2A cells. Bonferroni post hoc analysis of Vero cells revealed no significance at any time point. Bonferroni post hoc analysis of Neuro2A cells revealed significannce difference at eight and 16 h time point. Bonferroni post hoc analysis of RAW 264.7 cells revealed difference at 48 and 72 h time point. ** represents p < 0.01, * represents p < 0.05.

