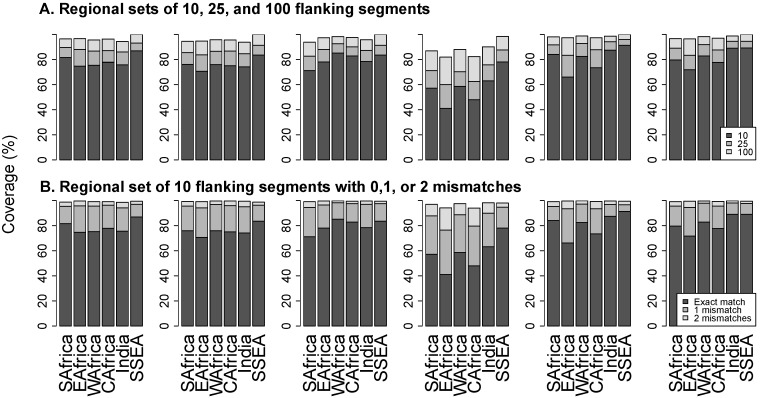
Figure 4.
Panel (A) shows the proportion of sequences that exactly match the 10 (black bar), 25 (dark grey), and 100 (light grey) most common regional flanking segments. Panel (B) shows the proportion of sequences that exactly match (black bar), differ by one nucleotide (dark grey), or differ by two nucleotides (light grey) from the 10 most common regional flanking sequences. Abbreviations: SAfrica, Southern Africa; EAfrica, East Africa; WAfrica, West Africa; CAfrica, Central Africa; SSEA, South and Southeast Asia.

