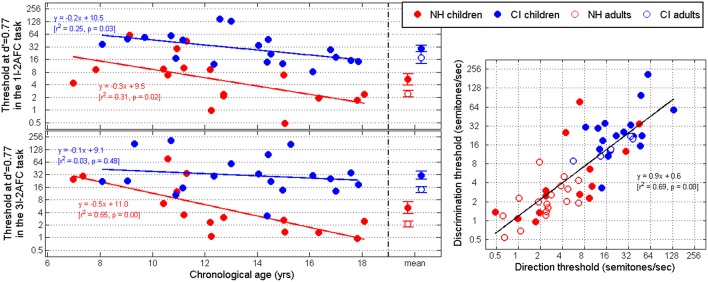
Figure 6.
Thresholds extracted at a d′ value of 0.77 for the direction (top-left) and discrimination (bottom-left) tasks, as a function of the child's chronological age. Adult data are represented only as means. (Right) Correlation between thresholds in the two tasks, including individual adult subject data.

