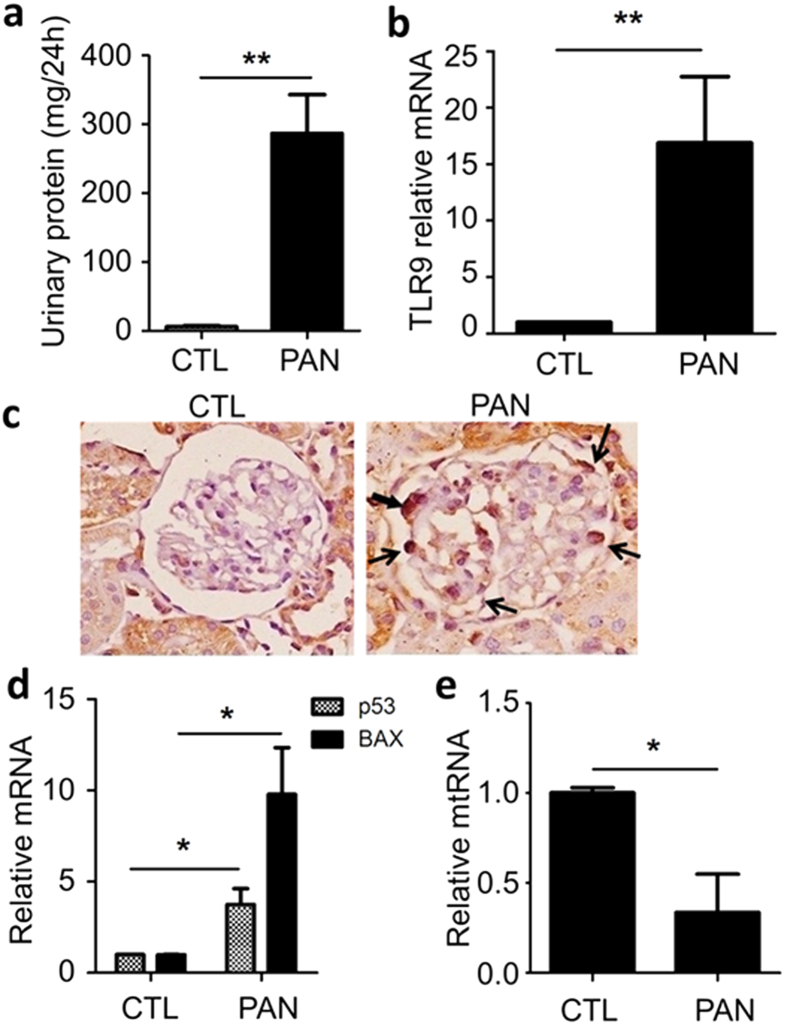
Figure 8. Characterization of PAN-treated rats.
(a) Marked proteinuria developed at day 6 following PAN injection. n = 6 in both control and PAN group. (b) qRT-PCR analysis of TLR9 mRNA in the glomeruli of control rats and PAN-treated rats. n = 6 in each group. (c) Immunohistochemical staining of TLR9 in the glomeruli of the rats, showing TLR9 proteins in the podocytes (arrows). n = 6 in each group. (d) qRT-PCR analysis of p53 and Bax in the glomeruli of the rats. (e) qPCR analysis of mtDNA in glomeruli of the rats. n = 6 in each group. *P < 0.05, **P < 0.01.

