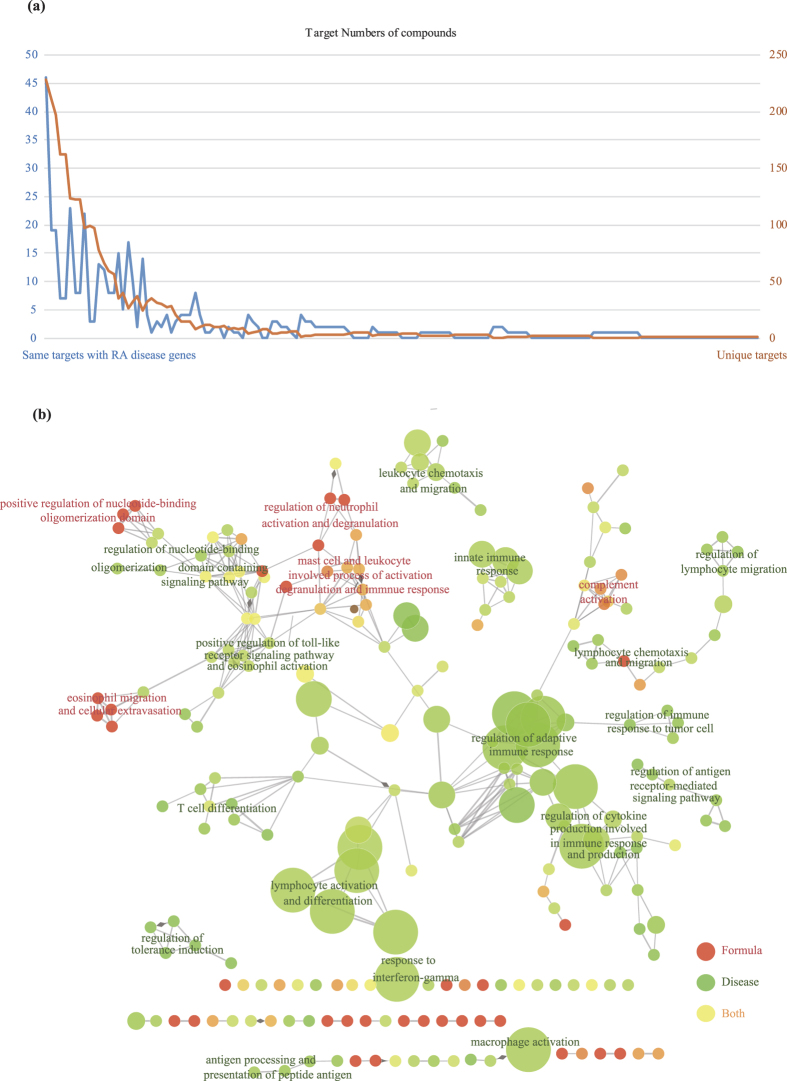
Figure 2. Relationship between formula targets and disease genes.
(a) The number of targets in different compounds. The orange line stands for the number of unique targets of the compounds while the blue line represents the targets that overlap disease targets. (b) The ratio of formula targets and disease genes in immune system processes. The network was generated with ClueGO in Cytoscape.

