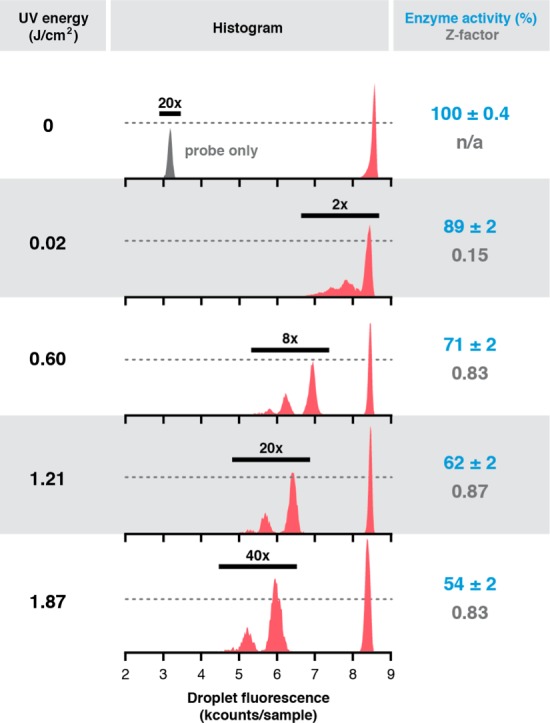
Figure 6.

Online dose–response analysis of assay droplet populations. Photochemical pepstatin A dosing in an HIV-1 protease biochemical activity assay results in a UV dose-dependent decrease in % enzyme activity (blue) and a rapid increase and plateau of Z-factor (gray). Z-factor is robust for screening (>0.5) and unchanging for all doses >0.02 J/cm2, defining the window of appropriate dose–response screening conditions for the device. The histograms compile raw data for >34 000 total droplets at each dose. Enzyme activity and Z-factor were calculated only for 1-bead droplets. The vertical position of the dashed line in each histogram represents 4000 droplets.
