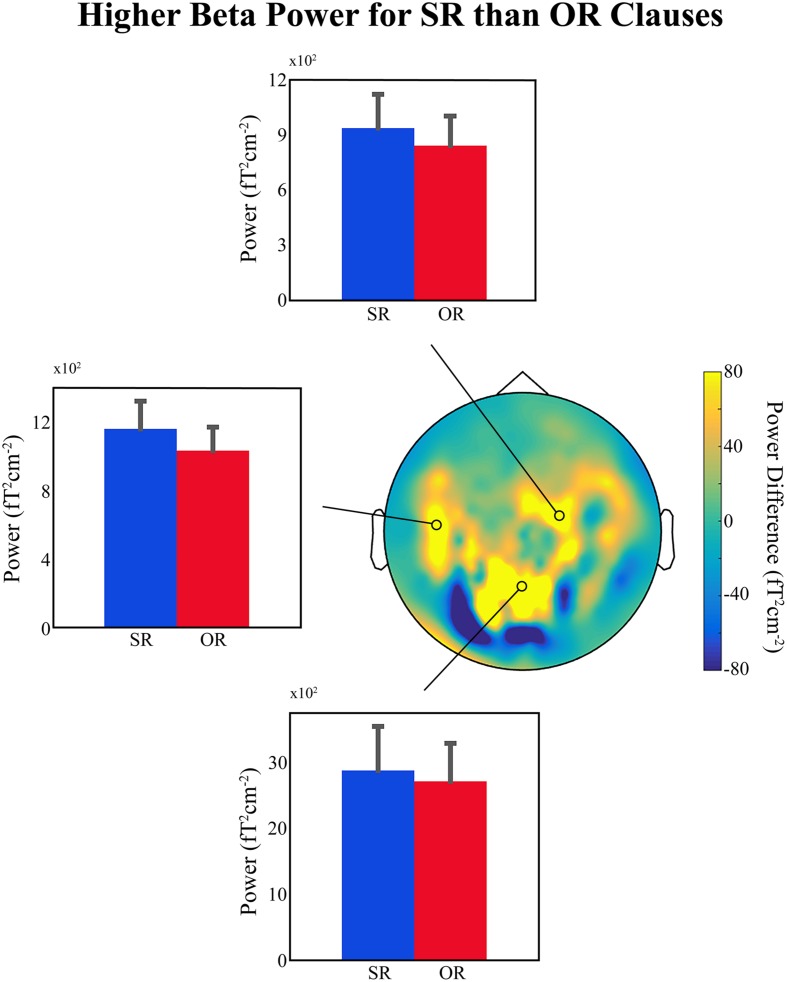
FIGURE 1.
Preliminary MEG findings. (Top, Middle Left, and Bottom) Bar plots showing the average beta power (12–16 Hz) for the subject-relative (SR) and object-relative (OR) conditions in a region between 750 and 1050 ms relative to the onset of the disambiguating auxiliary verb, and at three representative sensors. Error bars indicate standard error of the mean. (Middle Right) Topographical distribution of the difference in power (SR – OR) for the selected beta time-frequency range. Position of selected representative sensors indicated by black circles. Data presented were high-pass filtered above 0.1 Hz and artifacts related to power-line interference, superconducting quantum interference device (SQUID) jumps, muscle activity, eye-movements, eye-blinks, and cardiac activity were removed. The planar gradient representation of the data for each participant (25 in total – written ethical approval was obtained) was computed and a time-frequency decomposition was carried out using a series of Slepian tapers (Mitra and Pesaran, 1999), and a sliding-window approach in time steps of 20 ms and frequency steps of 2 Hz. Time windows of 500 ms and frequency smoothing of 4 Hz were employed. Data were then averaged over the time and frequency ranges of interest (see above) separately for each condition, and grand-averages across all participants were computed for comparison.

