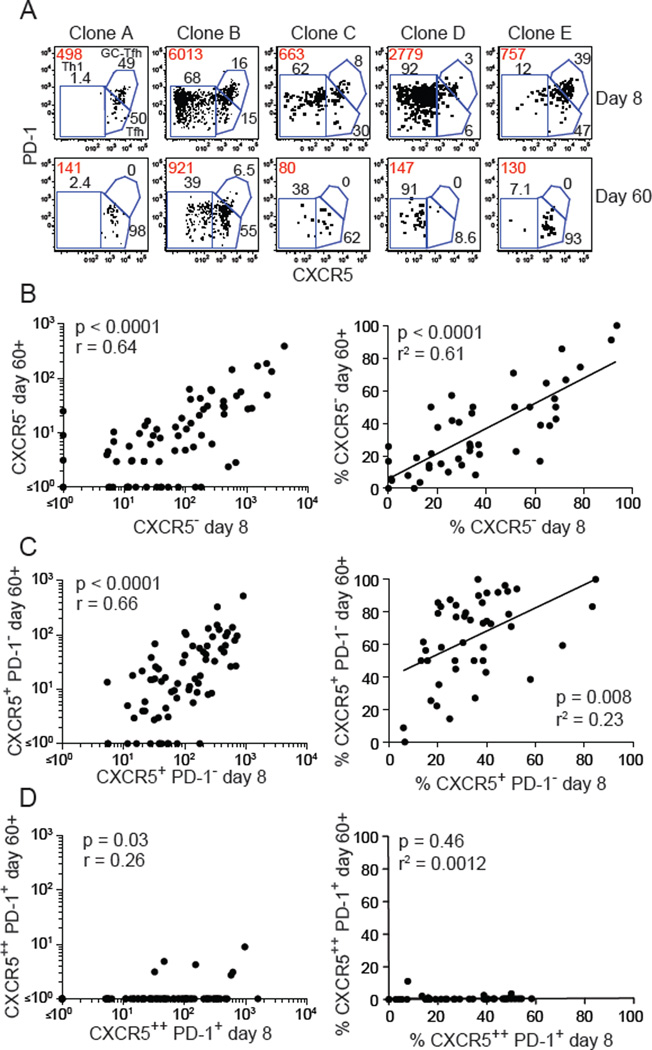
Fig. 3. Memory cells retain the CXCR5− and CXCR5+ phenotype of effector cells.
(A) Identification of Th1, Tfh, and GC-Tfh effector cells in different clonal populations of CD44high LLOp:I-Ab tetramer-binding cells on day 8 and day 60 after infection. Red values indicate the absolute number of cells in each population and black values indicate the percentages of each subset. (B-D, left panels) Numbers of CXCR5− (B), CXCR5+ PD-1− (C), or CXCR5++ PD-1+ (D) cells in clonal populations at day 8 and 60 or 62 after infection. Statistical values were calculated with the Spearman correlation test. (B-D, right panels) Percentages of cells in LLOp:I-Ab tetramer-binding clonal populations that were CXCR5− (B), CXCR5+ (C), or CXCR5++ PD-1+ (D) on day 8 plotted versus the percentages of those subpopulations 60–62 days after infection. Each dot represents a clonal population. Only populations in which 5 or more events were recovered at day 60 or 62 were included to optimize the meaningfulness of the percentage values. Statistical values and trend lines from linear regression analyses are shown. Each dot represents a single clonal population. Pooled results from 2 independent experiments are shown.

