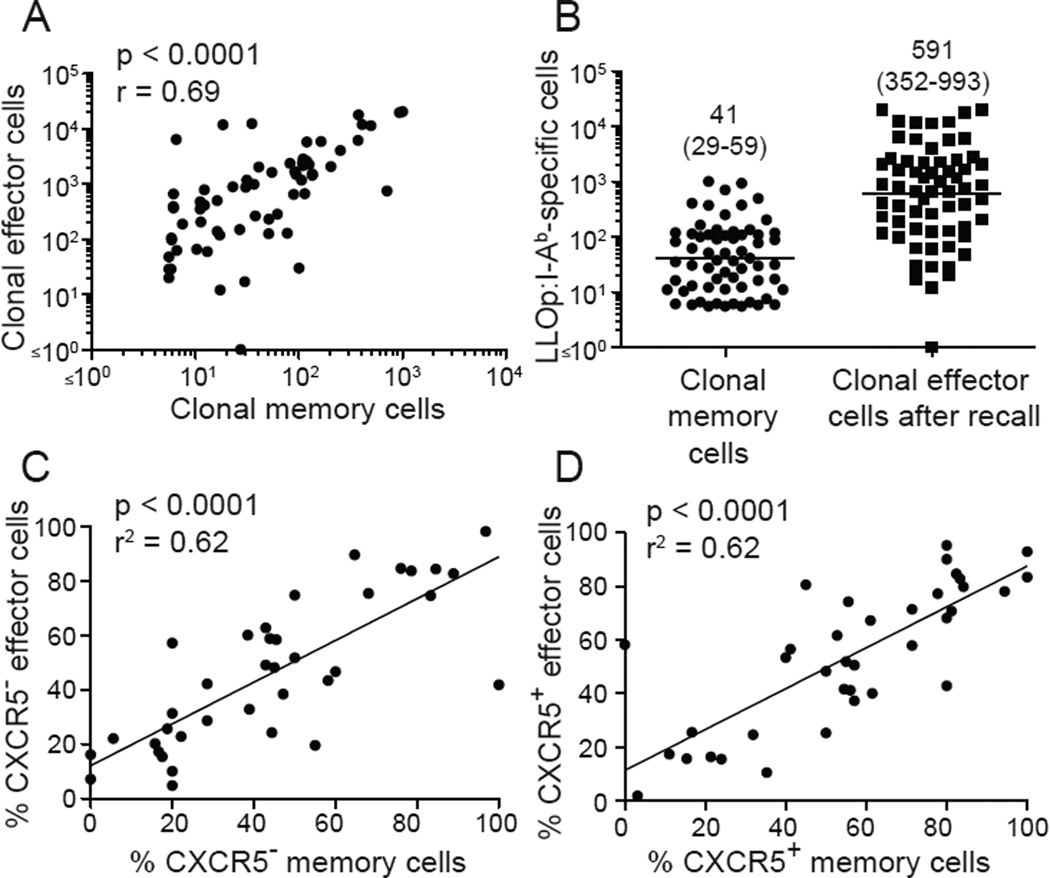
Fig. 4. Memory cells produce effector cells with a similar phenotype.
(A) Numbers of LLOp:I-Ab tetramer-binding memory cells in 65 clonal populations plotted versus the number of effector cells produced from those populations 7 days after a second infection. (B) Numbers of LLOp:I-Ab tetramer-binding memory cells in 65 clonal populations before (left column) or 7 days after a second infection (right column). Geometric mean values with 95% confidence intervals in parentheses are shown. (C-D) Percentages of CXCR5− or CXCR5+ memory cells in individual clonal populations plotted versus the percentages of CXCR5− or CXCR5+ effector cells generated from those populations after secondary infection. Statistical values and trend lines from linear regression analyses are shown. Pooled results from 3 independent experiments are shown.

