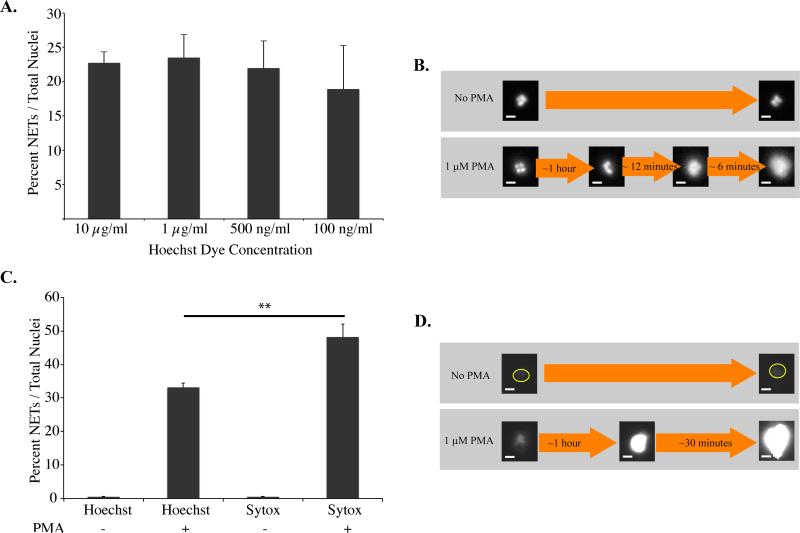
Figure 2. Hoechst stained NETs.
A, Percent NETs formed after 2 hours in Phorbyl 12-myristate 13-acetate (PMA) activated neutrophils stained with varying concentrations of Hoechst stain relative to total number of visualized nuclei. Differences between varying concentrations of Hoechst stain were statistically not significant as determined by one-way ANOVA (p-value < 0.2). B, Control (no PMA) and PMA activated neutrophils indicating changes in chromatin decondensation within the neutrophils over time. C, Percent NETs formed after 2 hours in PMA, stained with Hoechst stain (10 μg/ml) or Sytox Green (5 μM) stain. Statistically significant d D, Control (no PMA) and PMA activated neutrophils indicating increased Sytox Green staining after 90 minutes with PMA. Sytox Green staining identified 10 percent more NETs in comparison to Hoechst stain as determined by Student's T-test (**: p-value < 0.01). All data was repeated in duplicate or in triplicate at least three times. Neutrophils activated with PMA at 1 μM. White bar indicates 5 μm.

