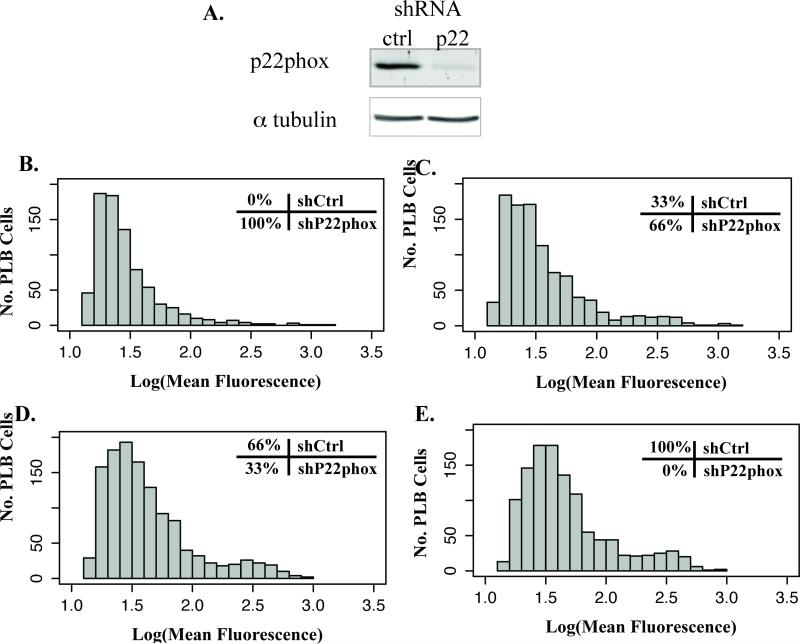
Figure 4. Comparison of ROS in heterogeneous cell line population.
The enzyme NADPH oxidase was knockdown in the myeloid cell line PLB-985 (shP22phox) and mixed with wild-type PLB-985 (shCtrl) in varying ratios. (A) Western blot analysis of PLB-985 lysate indicating successful p22phox knockdown. Histogram of log-transformed fluorescence of these population mixtures activated for 30 minutes with PMA 1μM indicates an increase in median fluorescence with increasing ratios of wild-type PLB-985. (B) shP22phox only, (C) 66% shP22phox and 33% shCtrl, (D) 33% shP22phox and 66% shCtrl, (E) shCtrl only.

