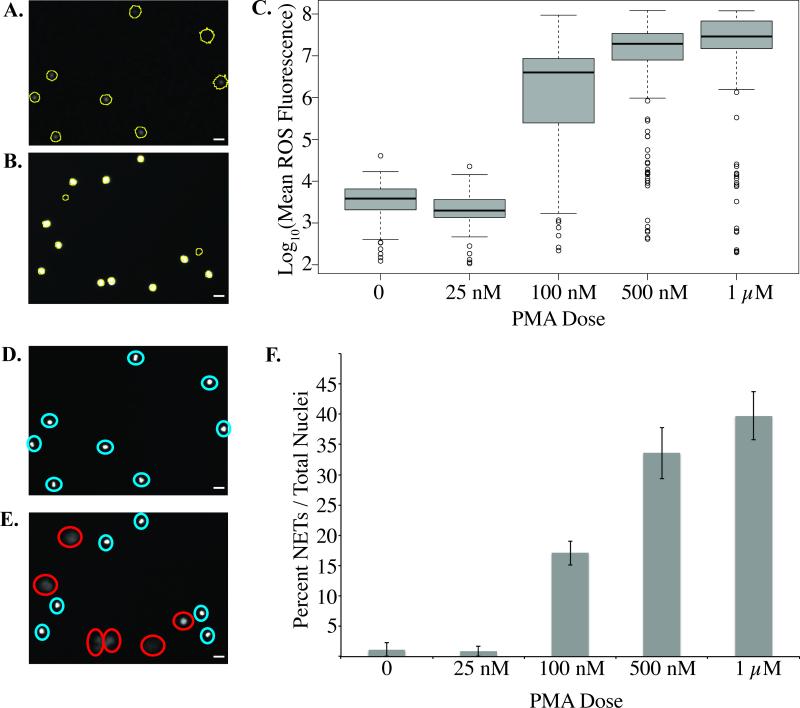
Figure 5. Dose-dependent PMA activation of neutrophils.
A-B, Representative images of dihydrorhodamine-123 (DHR) fluorescent image of (A) non-activated and (B) PMA-activated neutrophils at 30 minutes. Cells are circled in yellow. C, Box-plot of neutrophil reactive oxygen species (ROS) production at 30 minutes with varying PMA dosing. D-E, Representative images of Hoechst nuclear stain fluorescent image of (D) non-activated and (E) PMA-activated neutrophils. Intact nuclei are labeled by a blue circle and NETs are labeled by a red circle. Please note the fuzzy NET structures in comparison to the sharply stained intact neutrophils. F, Percent NETs formed in 3 hours with varying doses of PMA relative to total number of visualized nuclei. There is a significant increase in NETs with increasing concentrations of PMA as determined by one-way ANOVA (p-value < 0.05). All data was repeated in duplicate or in triplicate at least three times. White bars indicates 10 μm.

