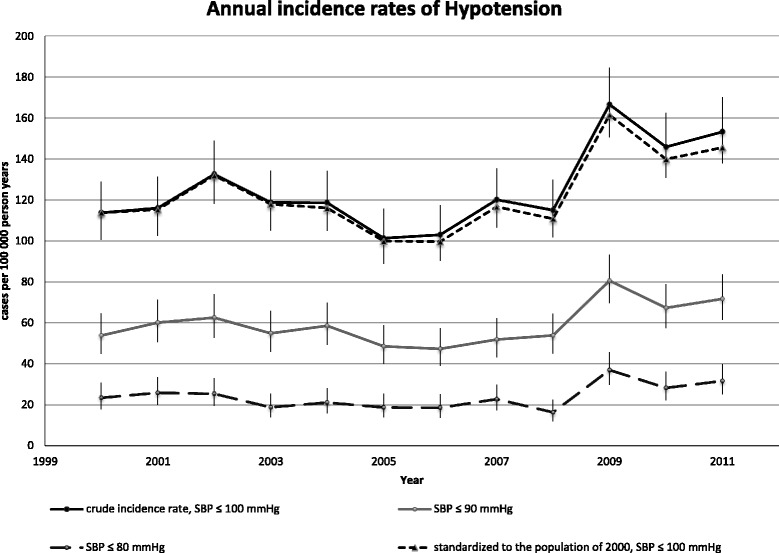
Fig. 3.

Annual incidence rate during 2000–2011. The crude annual incidence rates of hypotension from 2000 to 2011 and the standardized incidence rate to the population of the EDs cathment area in 2000 (using direct standardization on sex and ten-year age bands). Bars indicate the 95 % confidence interval based on a Poisson distribution. P-values represents Cuzick’s test for trend
