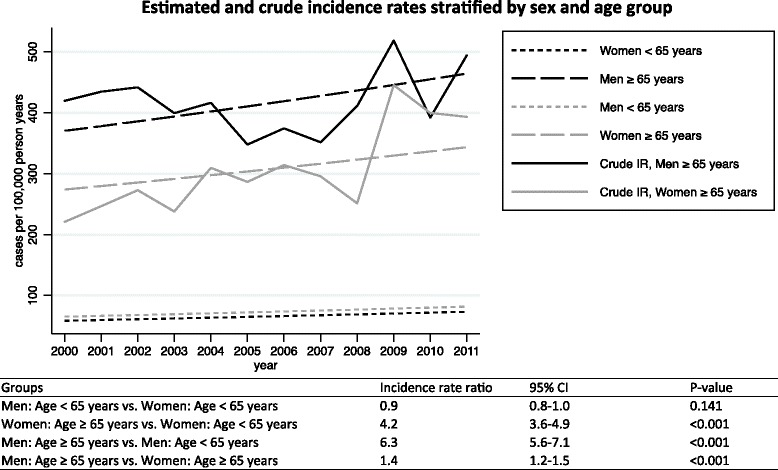
Fig. 4.

Estimated incidence rates and crude rates stratified by sex and age group from 2000 to 2011. Incidence rates estimated on the basis of a Poisson model adjusting for sex, age group, interaction between sex and age group, and calendar years. The table is showing the corresponding estimated incidence rate ratios with 95 % confidence intervals (95 % CI)
