
Fig. 1.
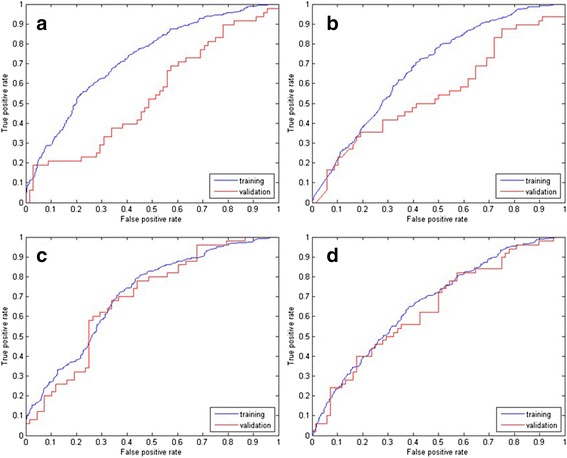
ROC curve for classification by MARS and LR with of scoring system. a: MARS model of SSS (p = 0.02); b: LR model of SSS (p = 0.03); c: MARS model of CASS (p = 0.71); d: LR model of CASS (p = 0.64)
Official websites use .gov
A
.gov website belongs to an official
government organization in the United States.
Secure .gov websites use HTTPS
A lock (
) or https:// means you've safely
connected to the .gov website. Share sensitive
information only on official, secure websites.
ROC curve for classification by MARS and LR with of scoring system. a: MARS model of SSS (p = 0.02); b: LR model of SSS (p = 0.03); c: MARS model of CASS (p = 0.71); d: LR model of CASS (p = 0.64)